 4
4peptides
spectra
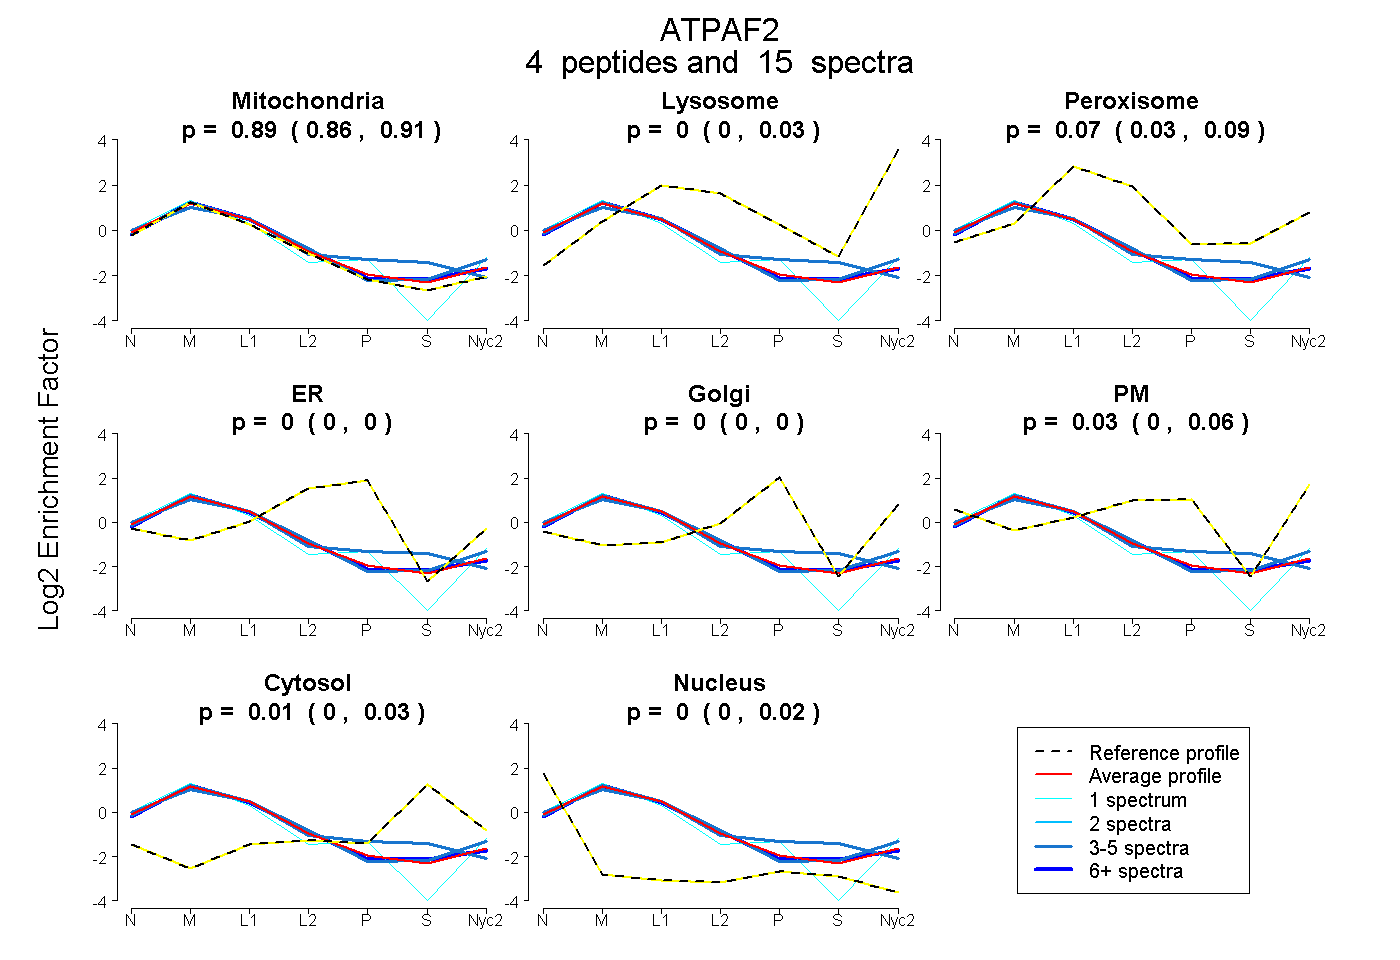
0.858 | 0.906
0.000 | 0.026
0.030 | 0.093
0.000 | 0.000
0.000 | 0.000
0.000 | 0.059
0.000 | 0.035
0.000 | 0.016
2peptides
spectra
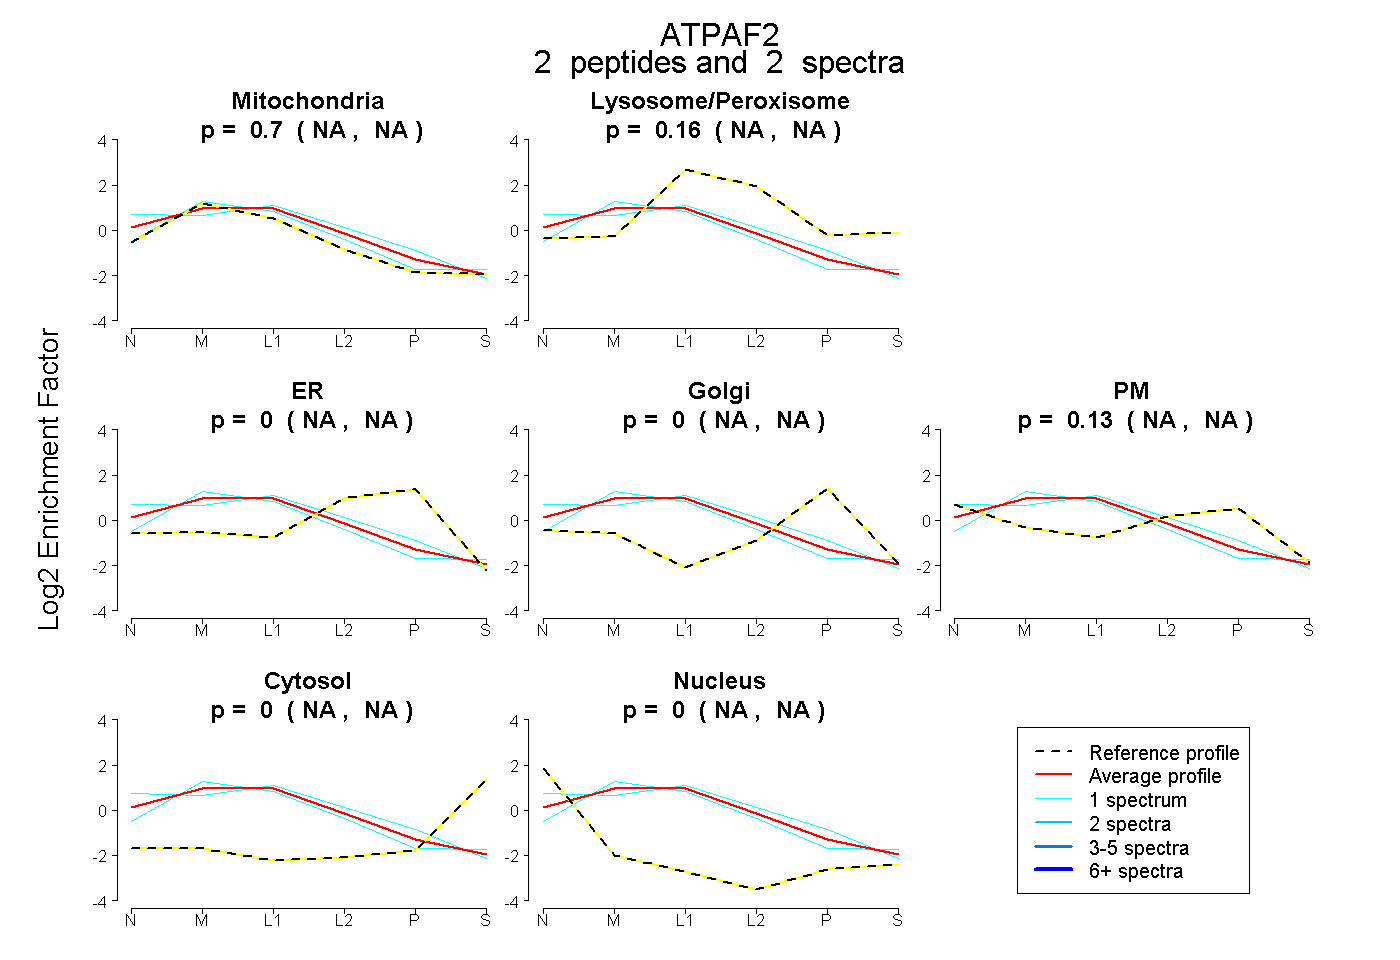
NA | NA
NA | NA
NA | NA
NA | NA
NA | NA
NA | NA
NA | NA
5peptides
spectra
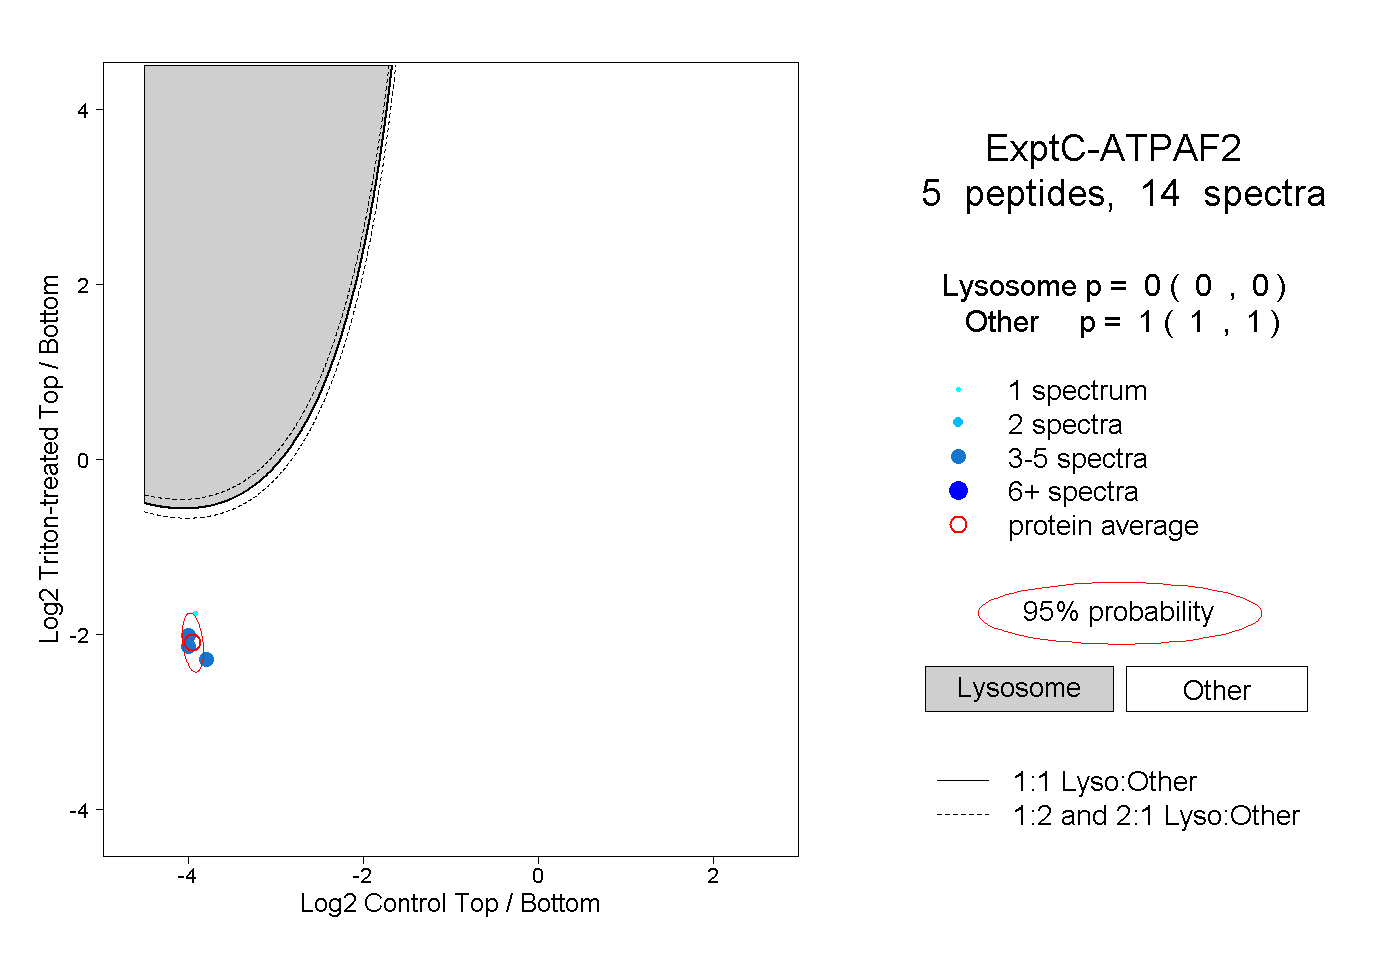
0.000 | 0.000
1.000 | 1.000
1peptide
spectrum
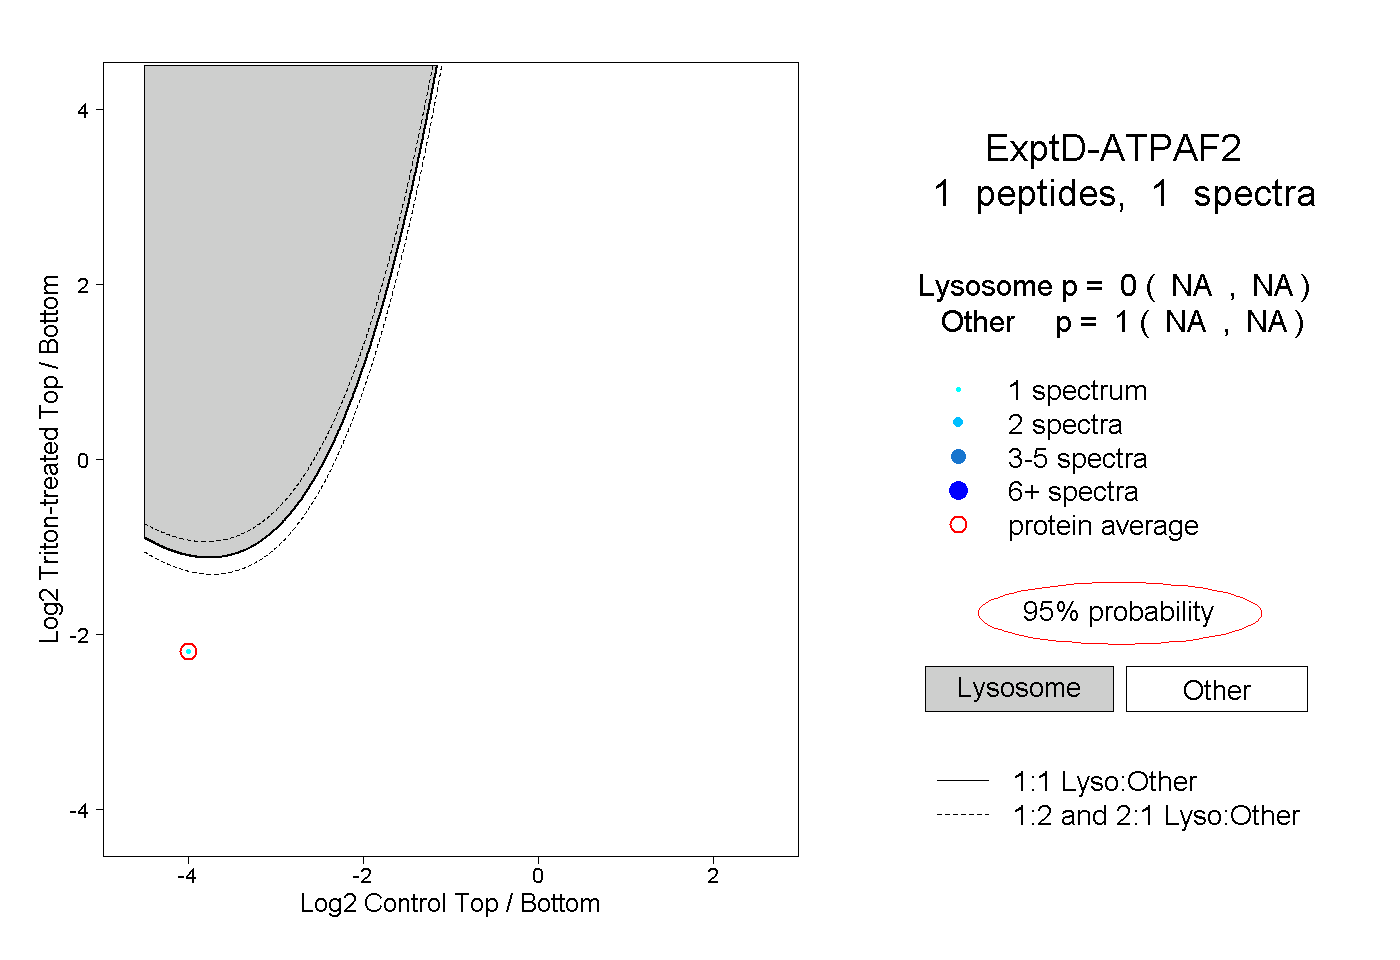
NA | NA
NA | NA