 2
2peptides
spectra
0.474 | 0.669
0.000 | 0.000
0.006 | 0.184
0.000 | 0.289
0.000 | 0.326
0.000 | 0.000
0.000 | 0.088
0.000 | 0.002
5peptides
spectra
0.000 | 0.000
1.000 | 1.000
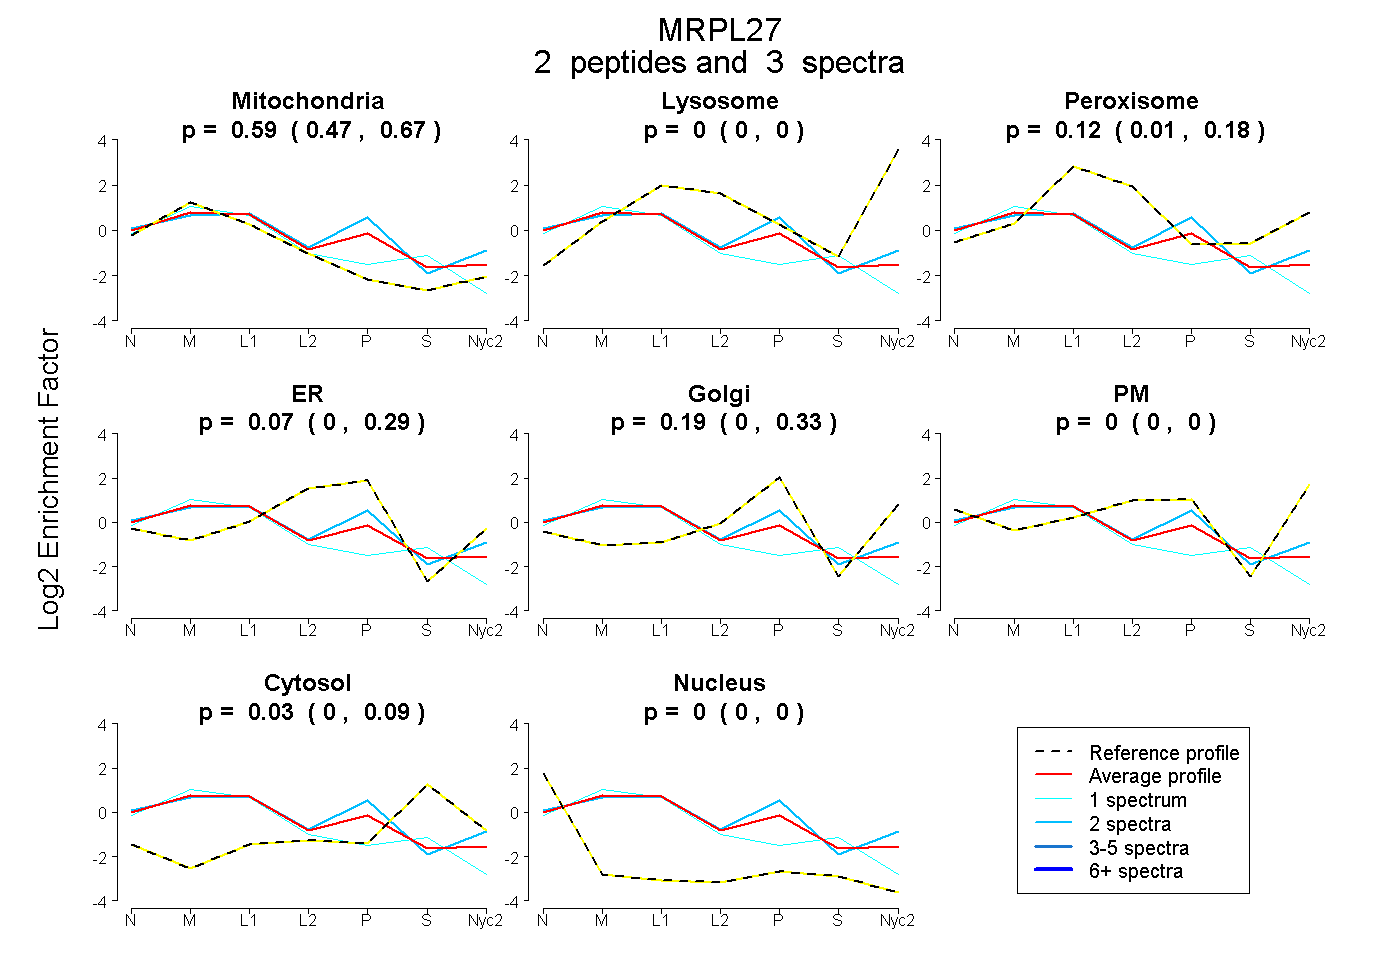
| Plot | Mito | Lyso | Perox | ER | Golgi | PM | Cytosol | Nucleus | |||||
| Expt A |
2 peptides |
3 spectra |
|
0.589 0.474 | 0.669 |
0.000 0.000 | 0.000 |
0.123 0.006 | 0.184 |
0.070 0.000 | 0.289 |
0.187 0.000 | 0.326 |
0.000 0.000 | 0.000 |
0.031 0.000 | 0.088 |
0.000 0.000 | 0.002 |
||
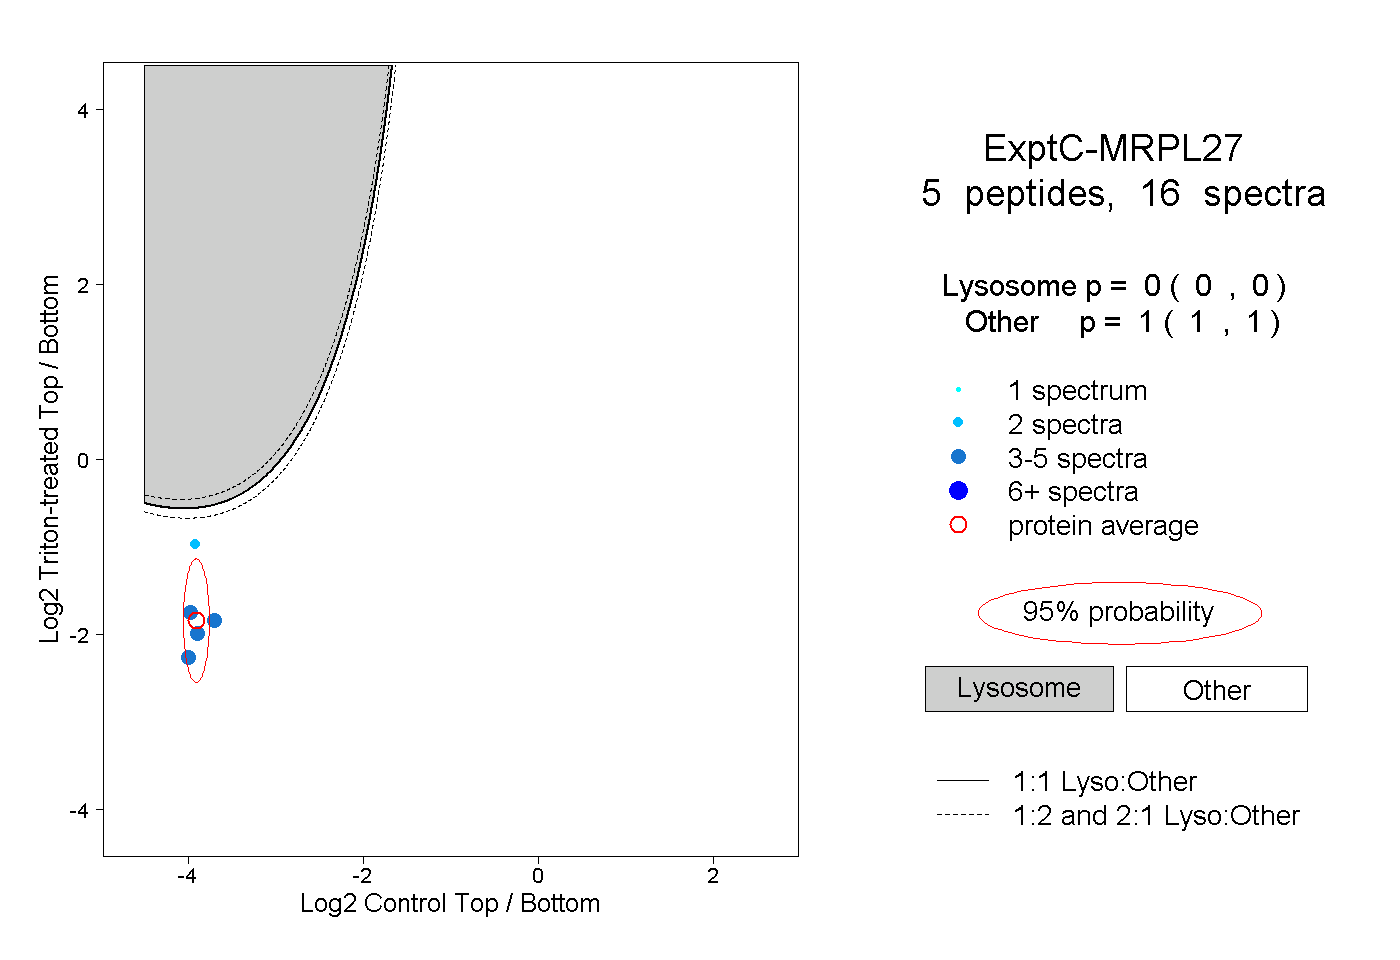
| Plot | Lyso | Other | |||||||||||
| Expt C |
5 peptides |
16 spectra |
|
0.000 0.000 | 0.000 |
1.000 1.000 | 1.000 |