16
16peptides
spectra
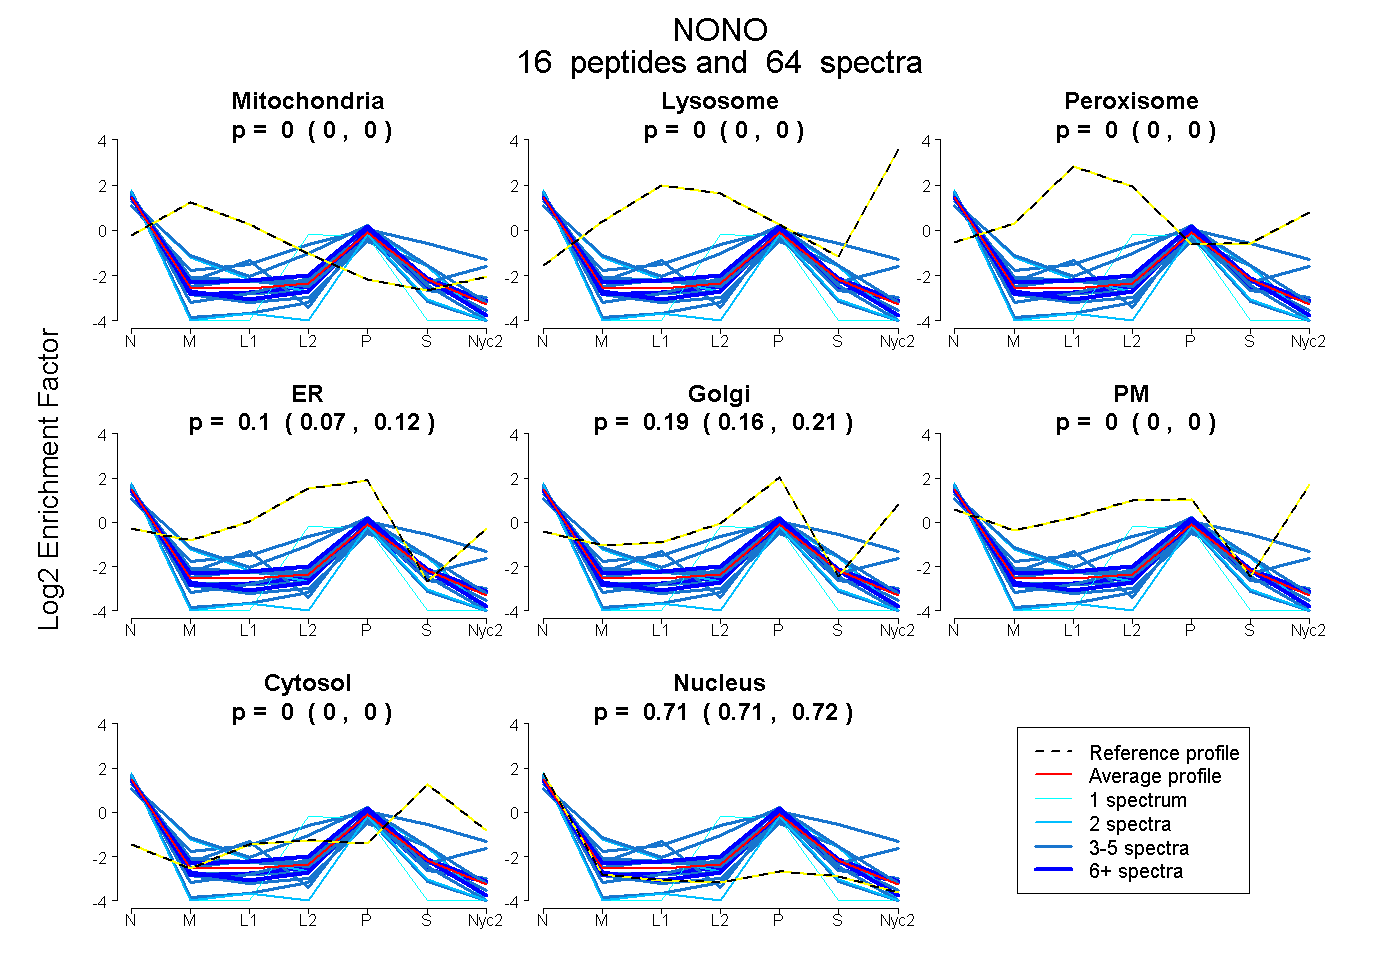
0.000 | 0.000
0.000 | 0.000
0.000 | 0.000
0.074 | 0.119
0.165 | 0.212
0.000 | 0.000
0.000 | 0.000
0.706 | 0.715
6peptides
spectra
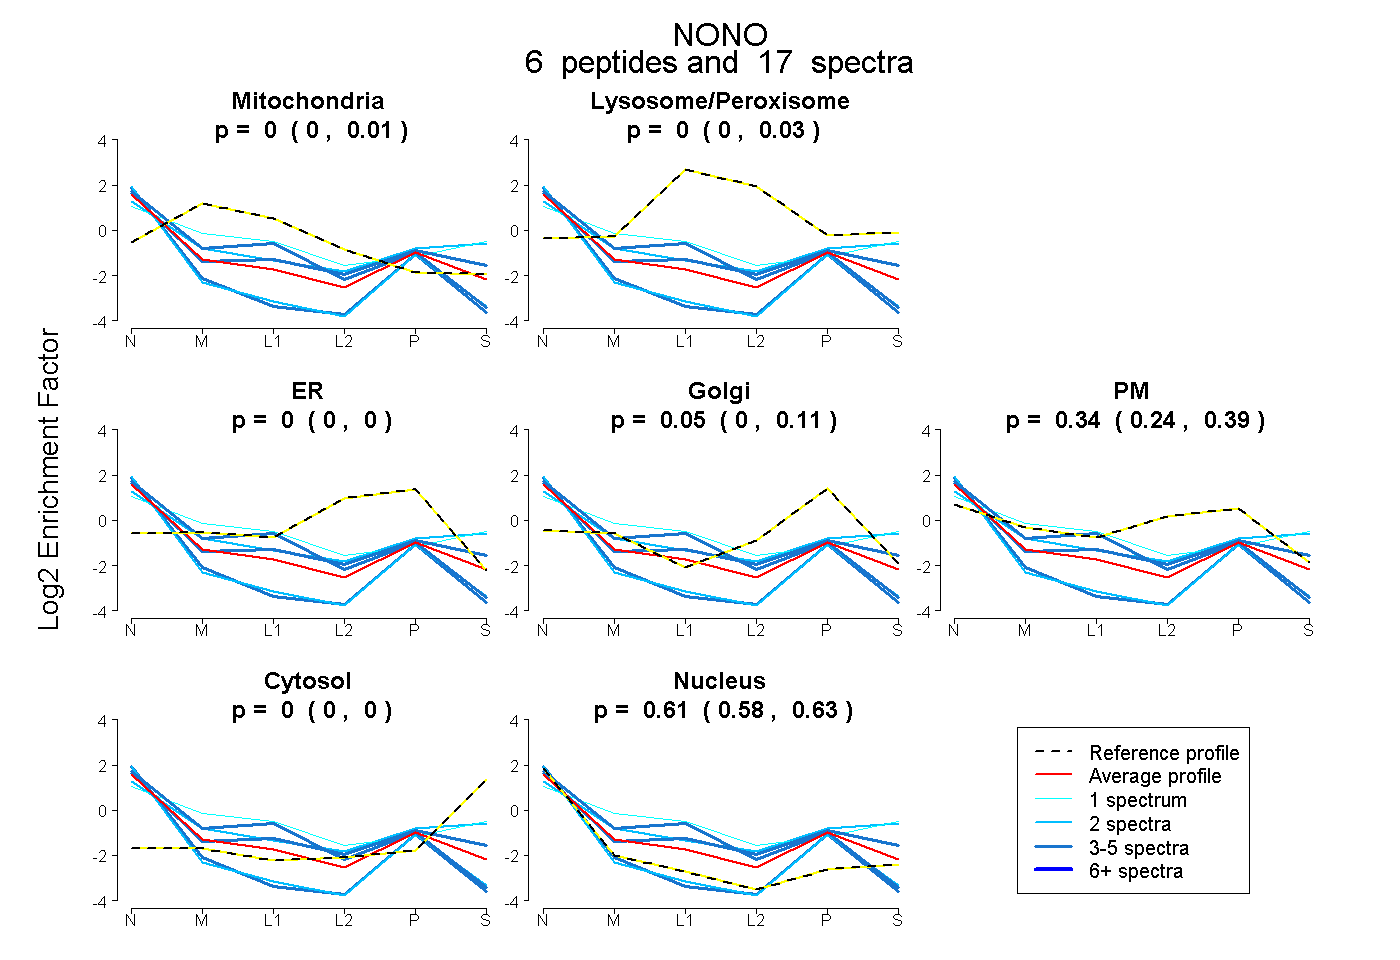
0.000 | 0.009
0.000 | 0.028
0.000 | 0.000
0.000 | 0.113
0.237 | 0.395
0.000 | 0.000
0.584 | 0.631