 2
2peptides
spectra
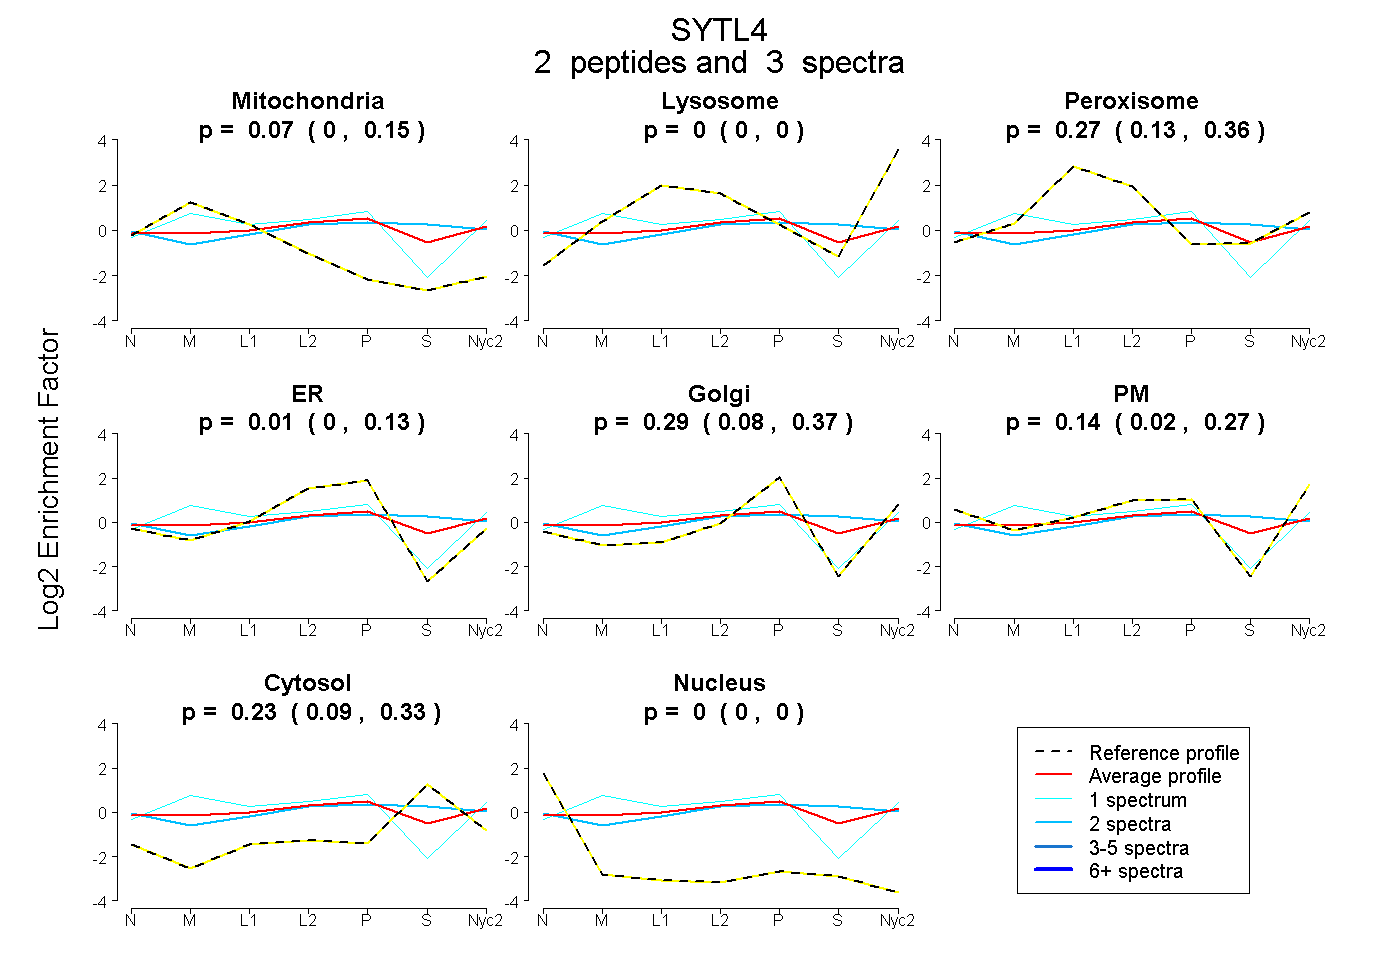
0.000 | 0.155
0.000 | 0.000
0.133 | 0.355
0.000 | 0.134
0.083 | 0.372
0.017 | 0.268
0.094 | 0.330
0.000 | 0.000
| Plot | Mito | Lyso | Perox | ER | Golgi | PM | Cytosol | Nucleus | |||||
| Expt A |
2 peptides |
3 spectra |
|
0.065 0.000 | 0.155 |
0.000 0.000 | 0.000 |
0.270 0.133 | 0.355 |
0.012 0.000 | 0.134 |
0.286 0.083 | 0.372 |
0.142 0.017 | 0.268 |
0.226 0.094 | 0.330 |
0.000 0.000 | 0.000 |
| 1 spectrum, YIPASK | 0.266 | 0.205 | 0.000 | 0.222 | 0.176 | 0.131 | 0.000 | 0.000 | ||
| 2 spectra, ECHQLAYADEAK | 0.000 | 0.000 | 0.215 | 0.079 | 0.045 | 0.248 | 0.414 | 0.000 |
| Plot | Lyso | Other | |||||||||||
| Expt C |
2 peptides |
3 spectra |
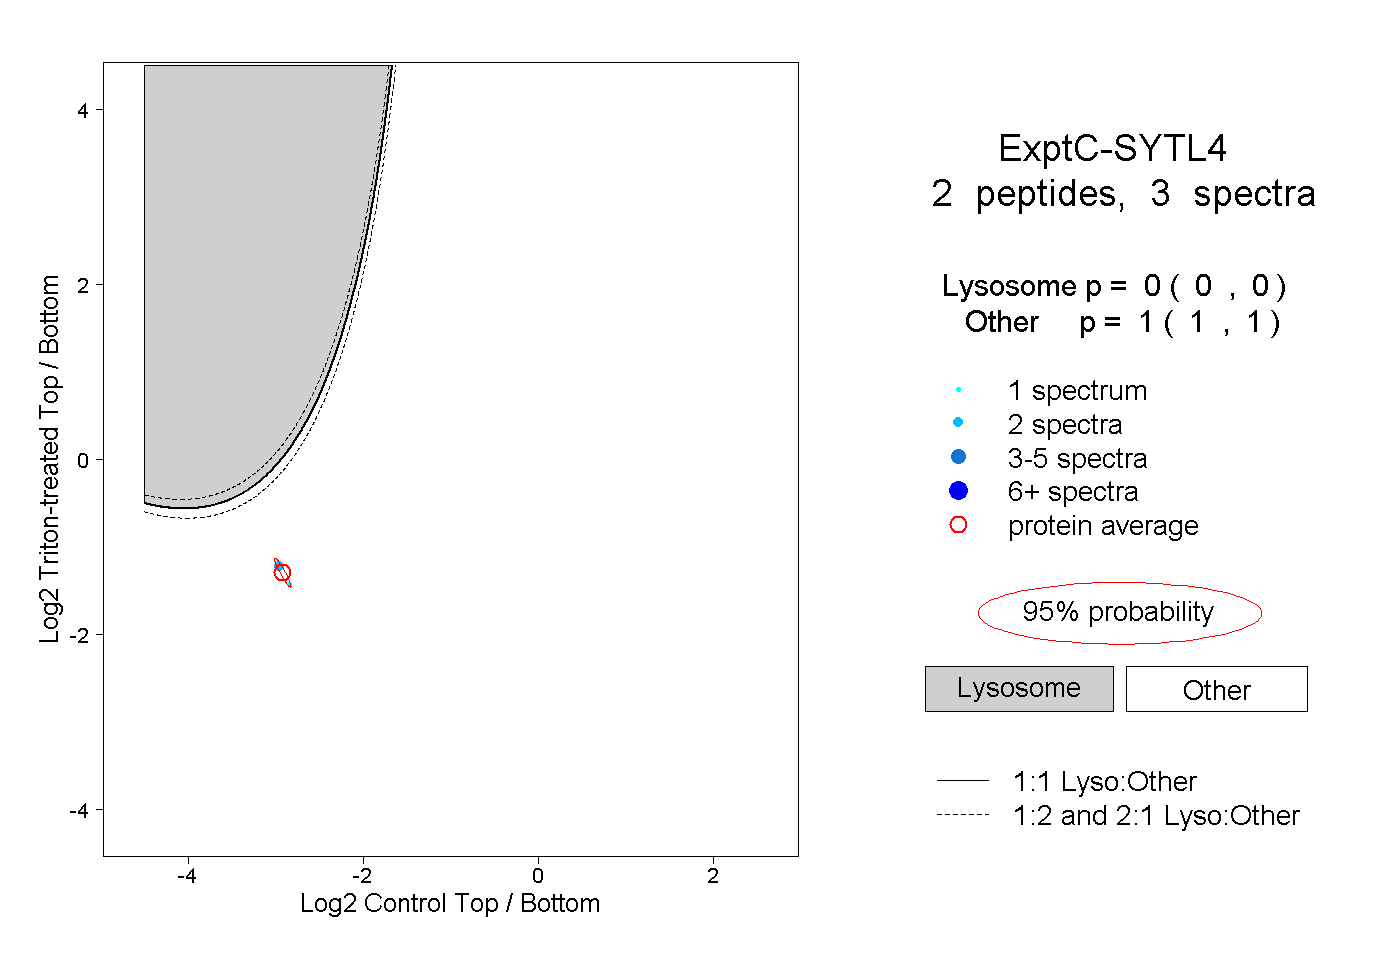 |
0.000 0.000 | 0.000 |
1.000 1.000 | 1.000 |