 3
3peptides
spectra
0.000 | 0.180
0.000 | 0.000
0.000 | 0.002
0.402 | 0.502
0.000 | 0.010
0.000 | 0.000
0.337 | 0.449
0.000 | 0.104
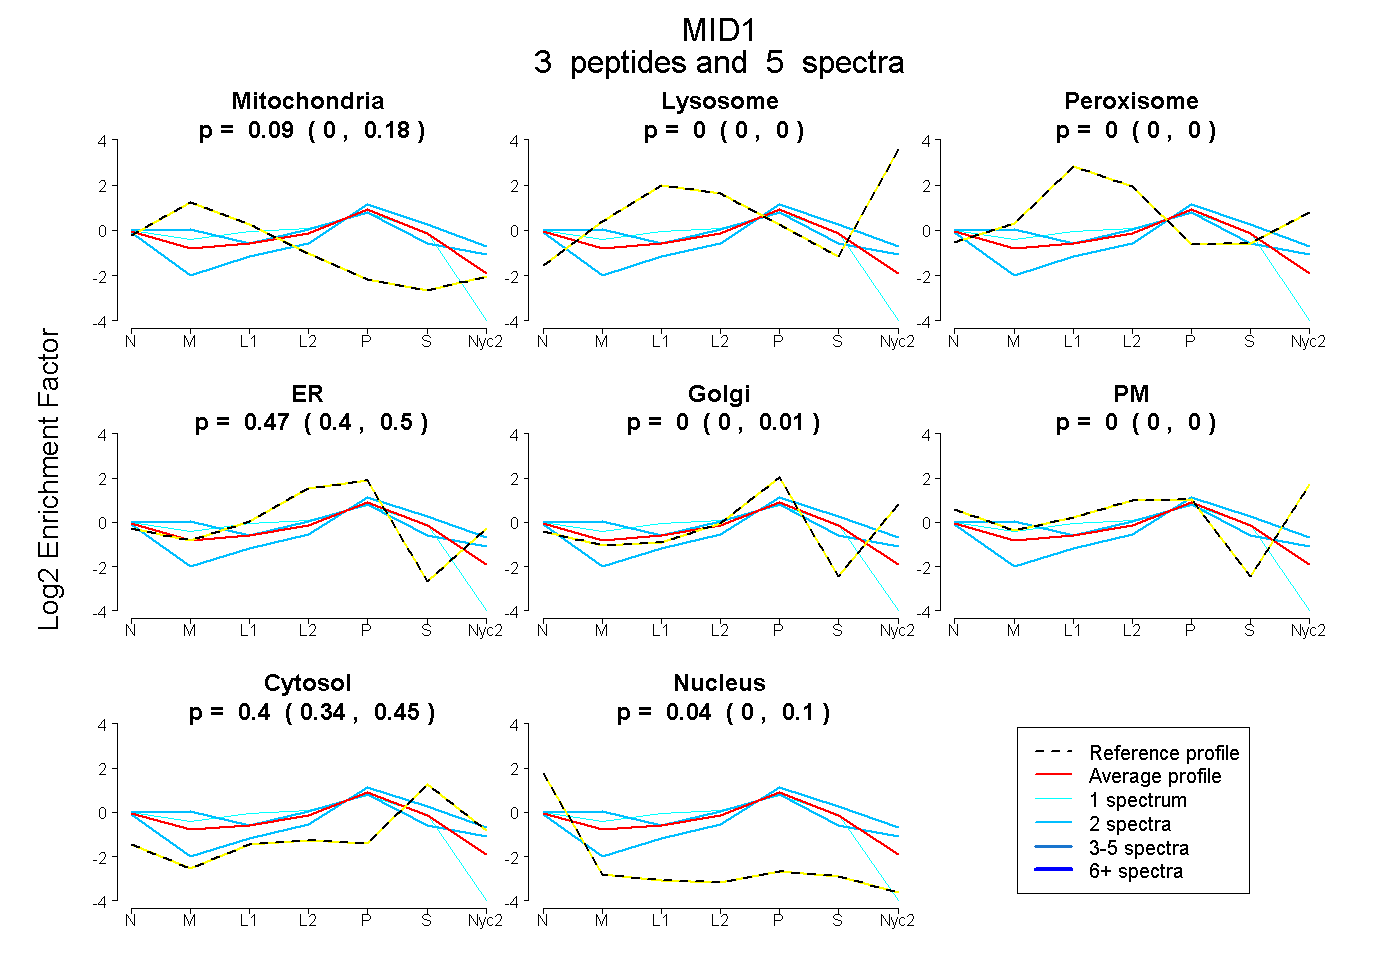
| Plot | Mito | Lyso | Perox | ER | Golgi | PM | Cytosol | Nucleus | |||||
| Expt A |
3 peptides |
5 spectra |
|
0.090 0.000 | 0.180 |
0.000 0.000 | 0.000 |
0.000 0.000 | 0.002 |
0.467 0.402 | 0.502 |
0.000 0.000 | 0.010 |
0.000 0.000 | 0.000 |
0.400 0.337 | 0.449 |
0.042 0.000 | 0.104 |
| 1 spectrum, EIPIEPAPHPR | 0.268 | 0.000 | 0.000 | 0.372 | 0.000 | 0.000 | 0.282 | 0.077 | ||
| 2 spectra, AINQAGSR | 0.000 | 0.000 | 0.000 | 0.148 | 0.320 | 0.000 | 0.533 | 0.000 | ||
| 2 spectra, LIQTCQHVEVNASR | 0.203 | 0.000 | 0.011 | 0.442 | 0.063 | 0.000 | 0.280 | 0.000 |