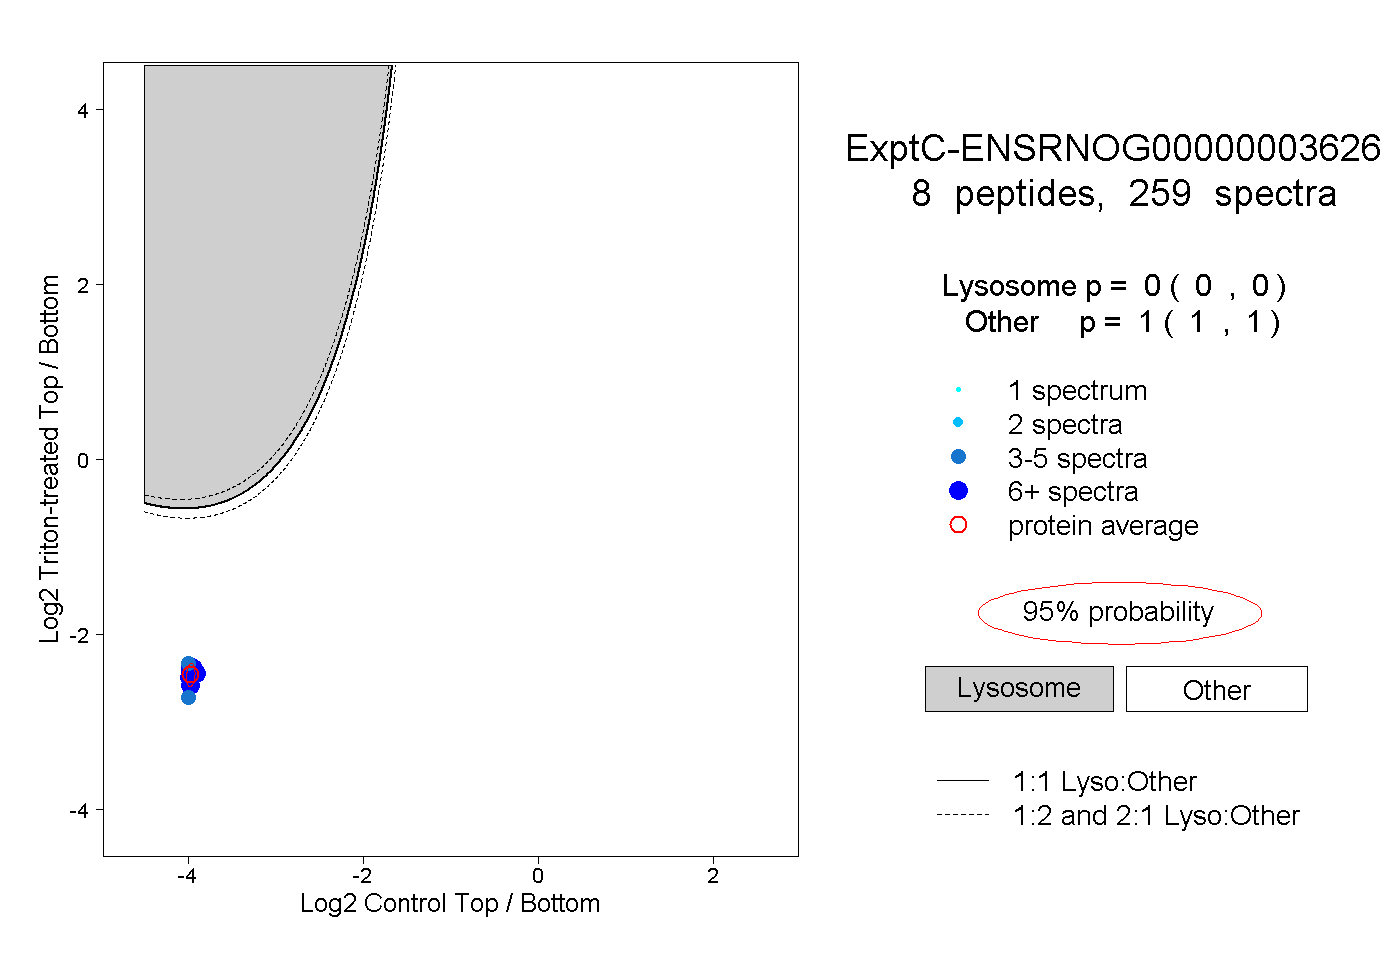
8
8peptides
spectra
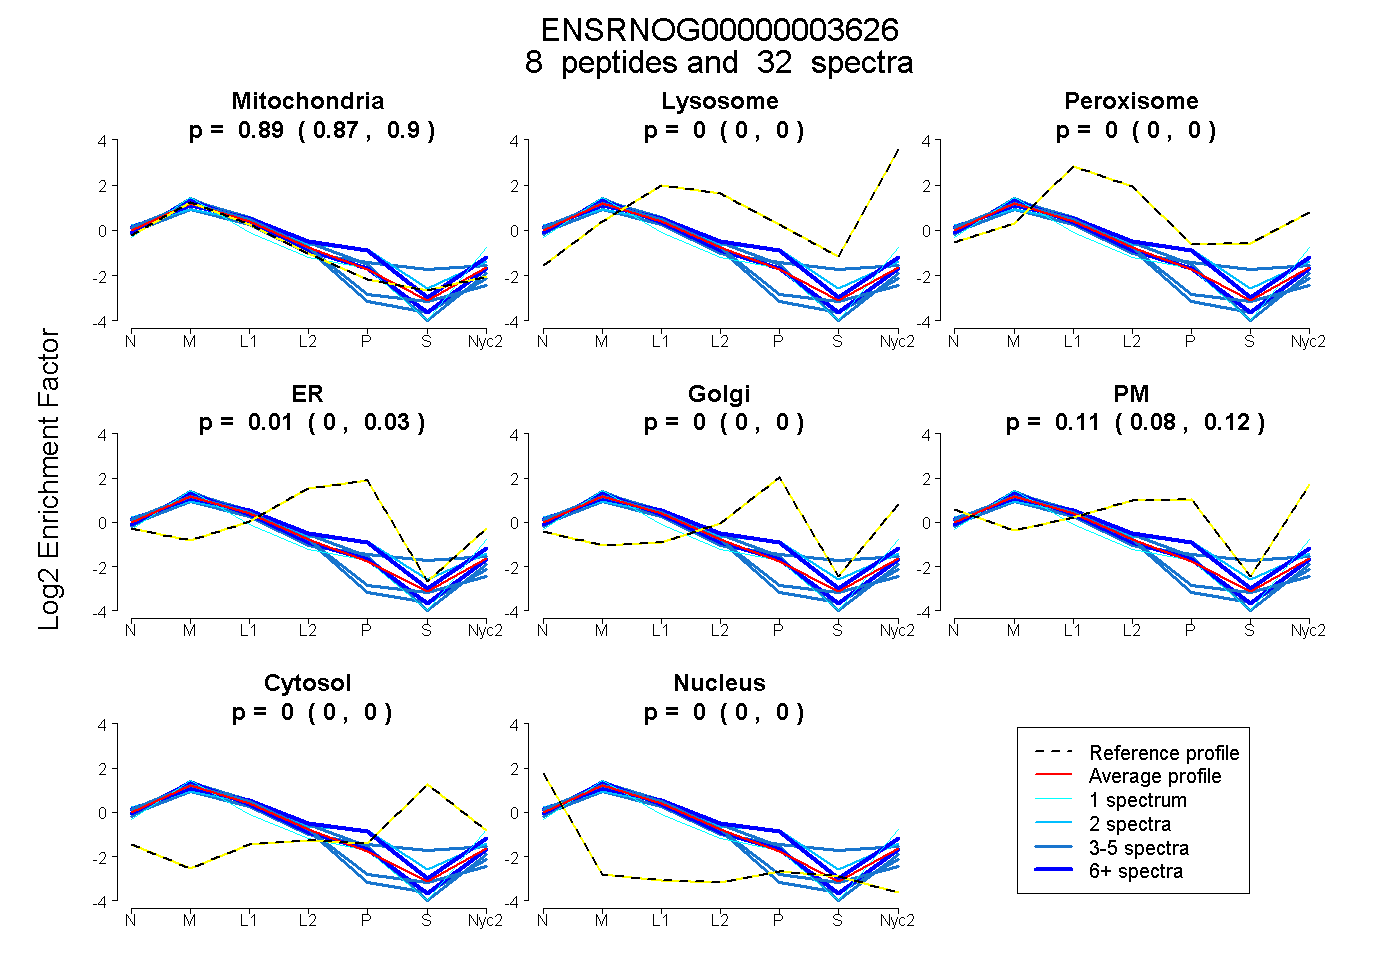
0.872 | 0.899
0.000 | 0.000
0.000 | 0.000
0.000 | 0.033
0.000 | 0.000
0.077 | 0.119
0.000 | 0.000
0.000 | 0.000
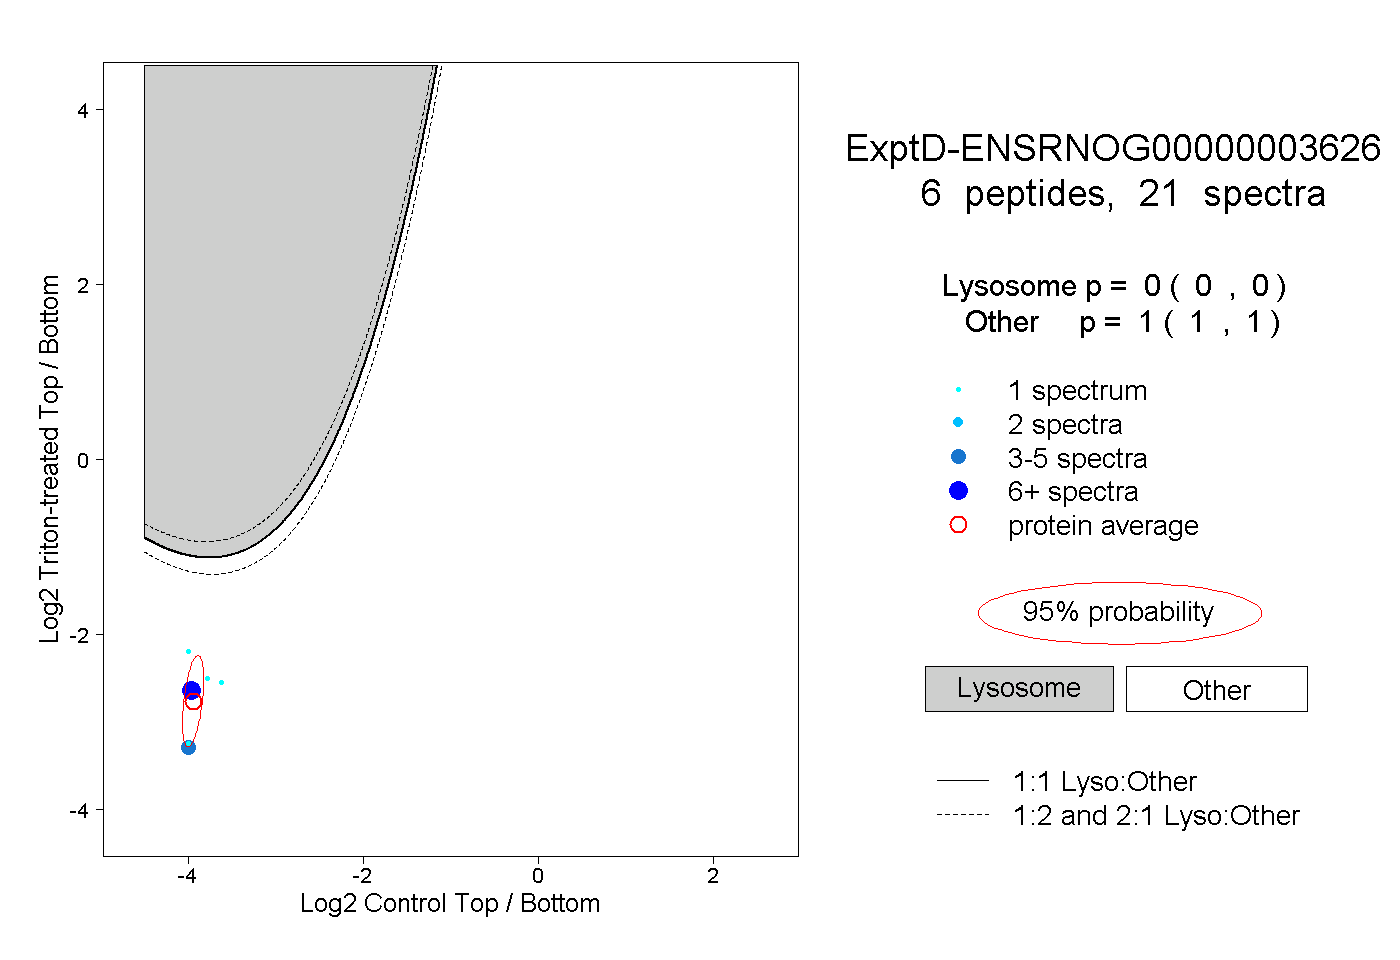
6peptides
spectra
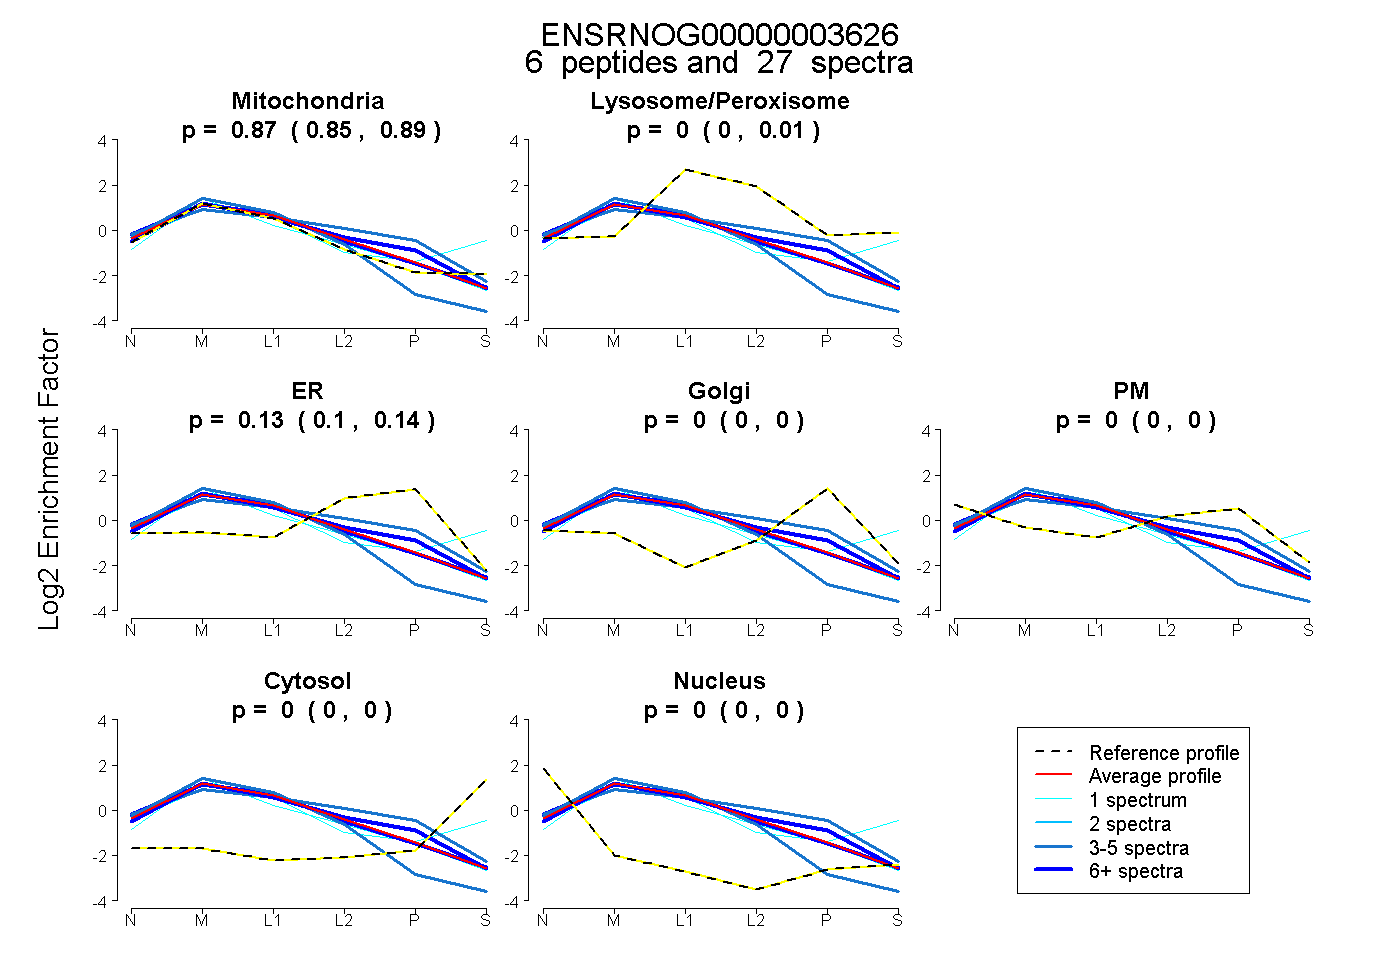
0.850 | 0.894
0.000 | 0.006
0.102 | 0.145
0.000 | 0.000
0.000 | 0.000
0.000 | 0.000
0.000 | 0.000