 8
8peptides
spectra
0.872 | 0.899
0.000 | 0.000
0.000 | 0.000
0.000 | 0.033
0.000 | 0.000
0.077 | 0.119
0.000 | 0.000
0.000 | 0.000
| Plot | Mito | Lyso | Perox | ER | Golgi | PM | Cytosol | Nucleus | |||||
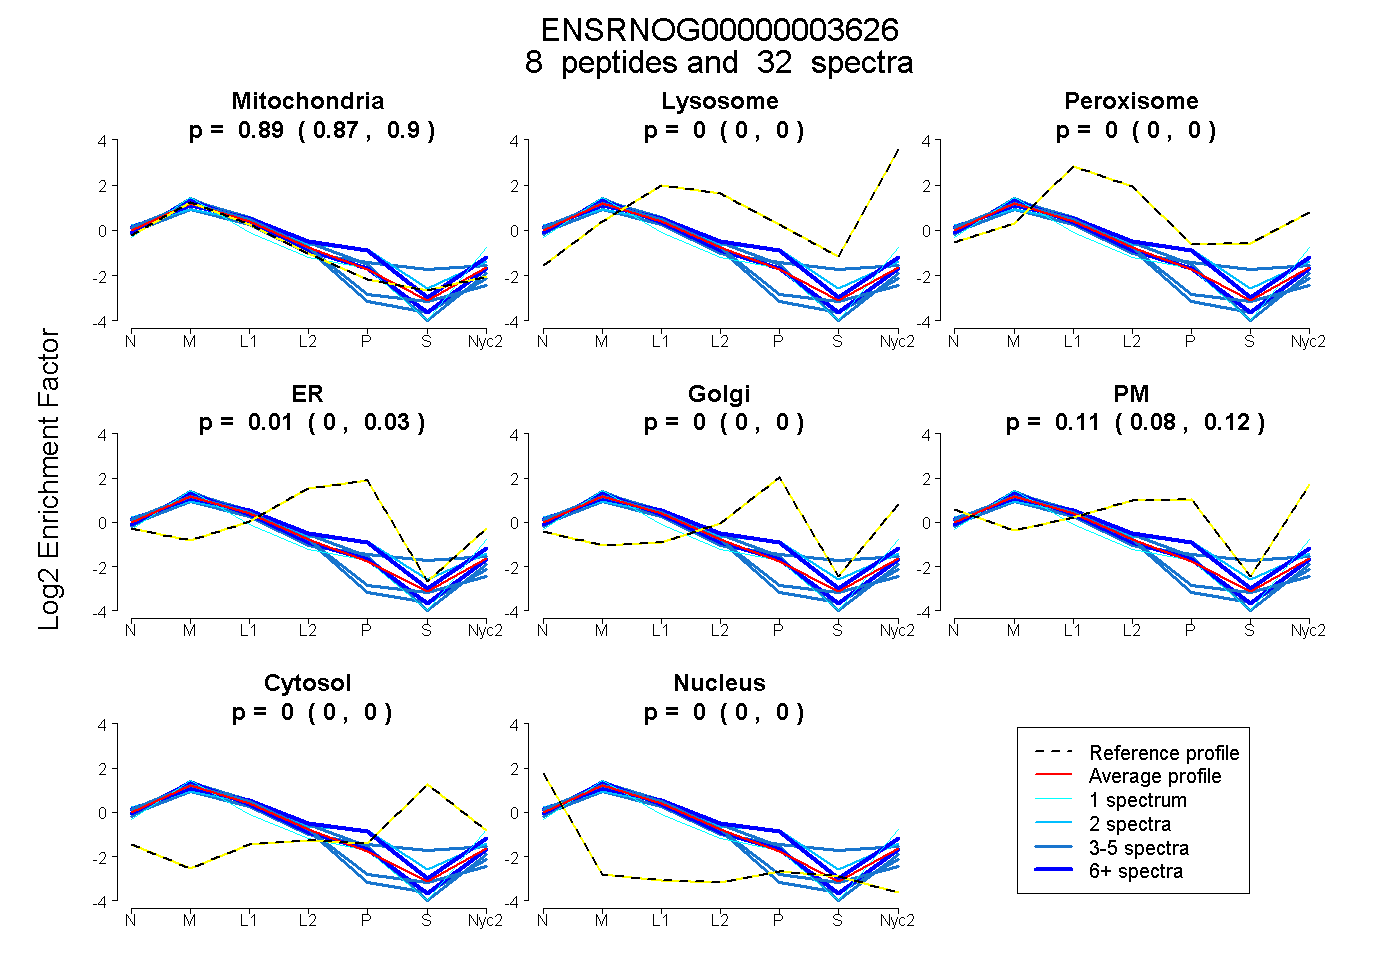
| Expt A |
8 peptides |
32 spectra |
|
0.888 0.872 | 0.899 |
0.000 0.000 | 0.000 |
0.000 0.000 | 0.000 |
0.007 0.000 | 0.033 |
0.000 0.000 | 0.000 |
0.105 0.077 | 0.119 |
0.000 0.000 | 0.000 |
0.000 0.000 | 0.000 |
| 3 spectra, LASLSEKPPAIDWAYYR | 0.871 | 0.000 | 0.000 | 0.129 | 0.000 | 0.000 | 0.000 | 0.000 | ||
| 2 spectra, ANVDKPGLVDDFK | 0.721 | 0.000 | 0.000 | 0.130 | 0.000 | 0.149 | 0.000 | 0.000 | ||
| 6 spectra, NCAQFVTGSQAR | 0.900 | 0.000 | 0.000 | 0.026 | 0.000 | 0.073 | 0.000 | 0.000 | ||
| 4 spectra, TIDWVSFVEIMPQNQK | 0.978 | 0.000 | 0.000 | 0.000 | 0.000 | 0.000 | 0.000 | 0.022 | ||
| 1 spectrum, YTALVDAEEK | 0.832 | 0.000 | 0.000 | 0.000 | 0.028 | 0.140 | 0.000 | 0.000 | ||
| 5 spectra, AIGNALK | 0.753 | 0.000 | 0.079 | 0.000 | 0.066 | 0.000 | 0.102 | 0.000 | ||
| 3 spectra, IPVPEDK | 1.000 | 0.000 | 0.000 | 0.000 | 0.000 | 0.000 | 0.000 | 0.000 | ||
| 8 spectra, SWNETFHTR | 0.709 | 0.000 | 0.000 | 0.086 | 0.000 | 0.205 | 0.000 | 0.000 |
| Plot | Mito | Lyso or Perox | ER | Golgi | PM | Cytosol | Nucleus | ||||||
| Expt B |
6 peptides |
27 spectra |
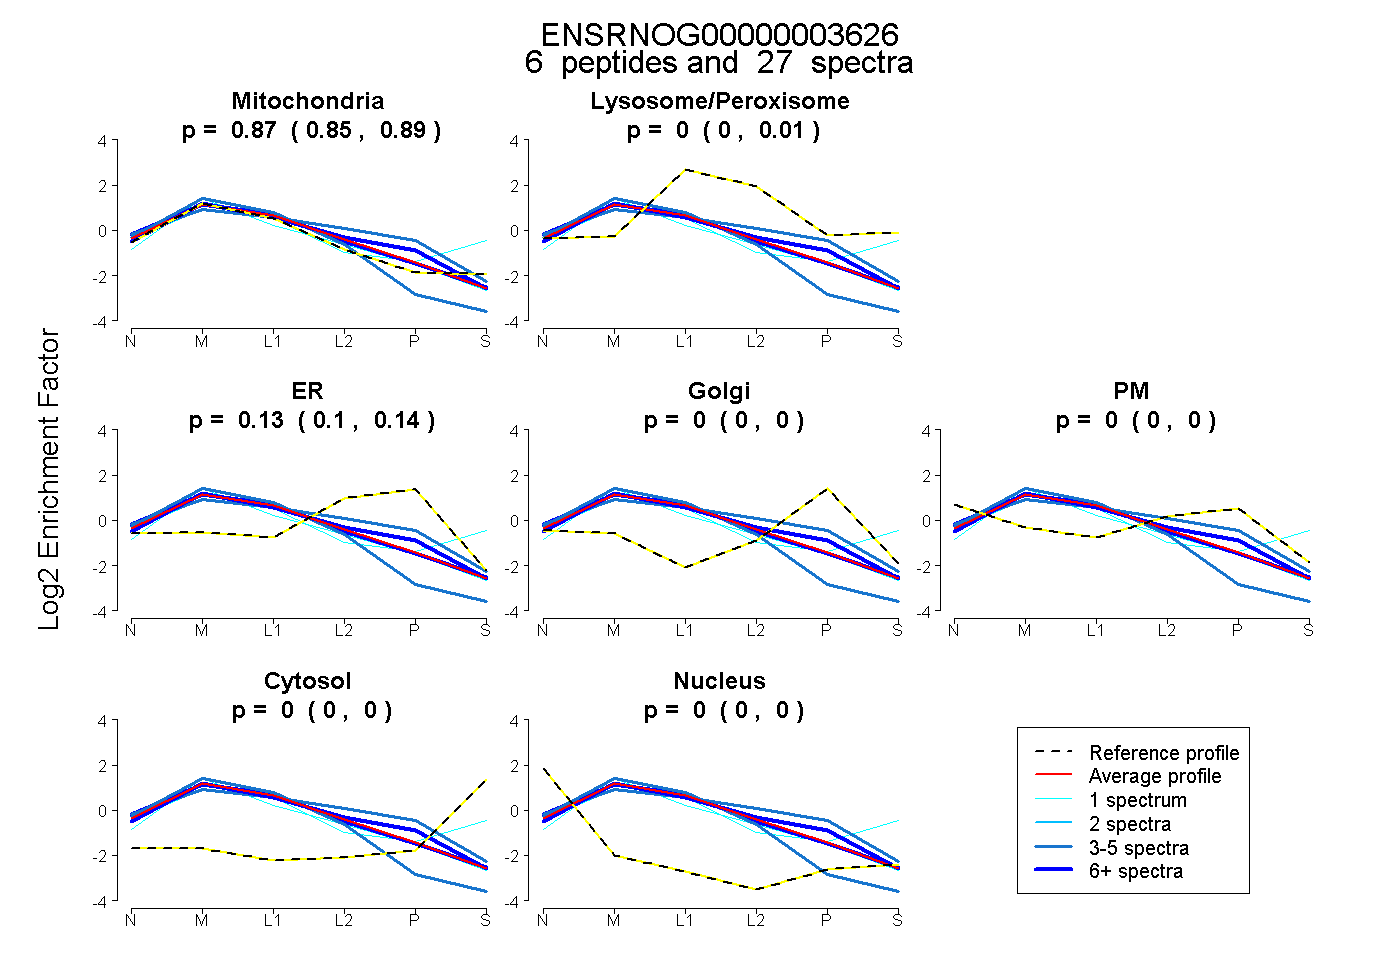 |
0.874 0.850 | 0.894 |
0.000 0.000 | 0.006 |
0.126 0.102 | 0.145 |
0.000 0.000 | 0.000 |
0.000 0.000 | 0.000 |
0.000 0.000 | 0.000 |
0.000 0.000 | 0.000 |
|||
| Plot | Lyso | Other | |||||||||||
| Expt C |
8 peptides |
259 spectra |
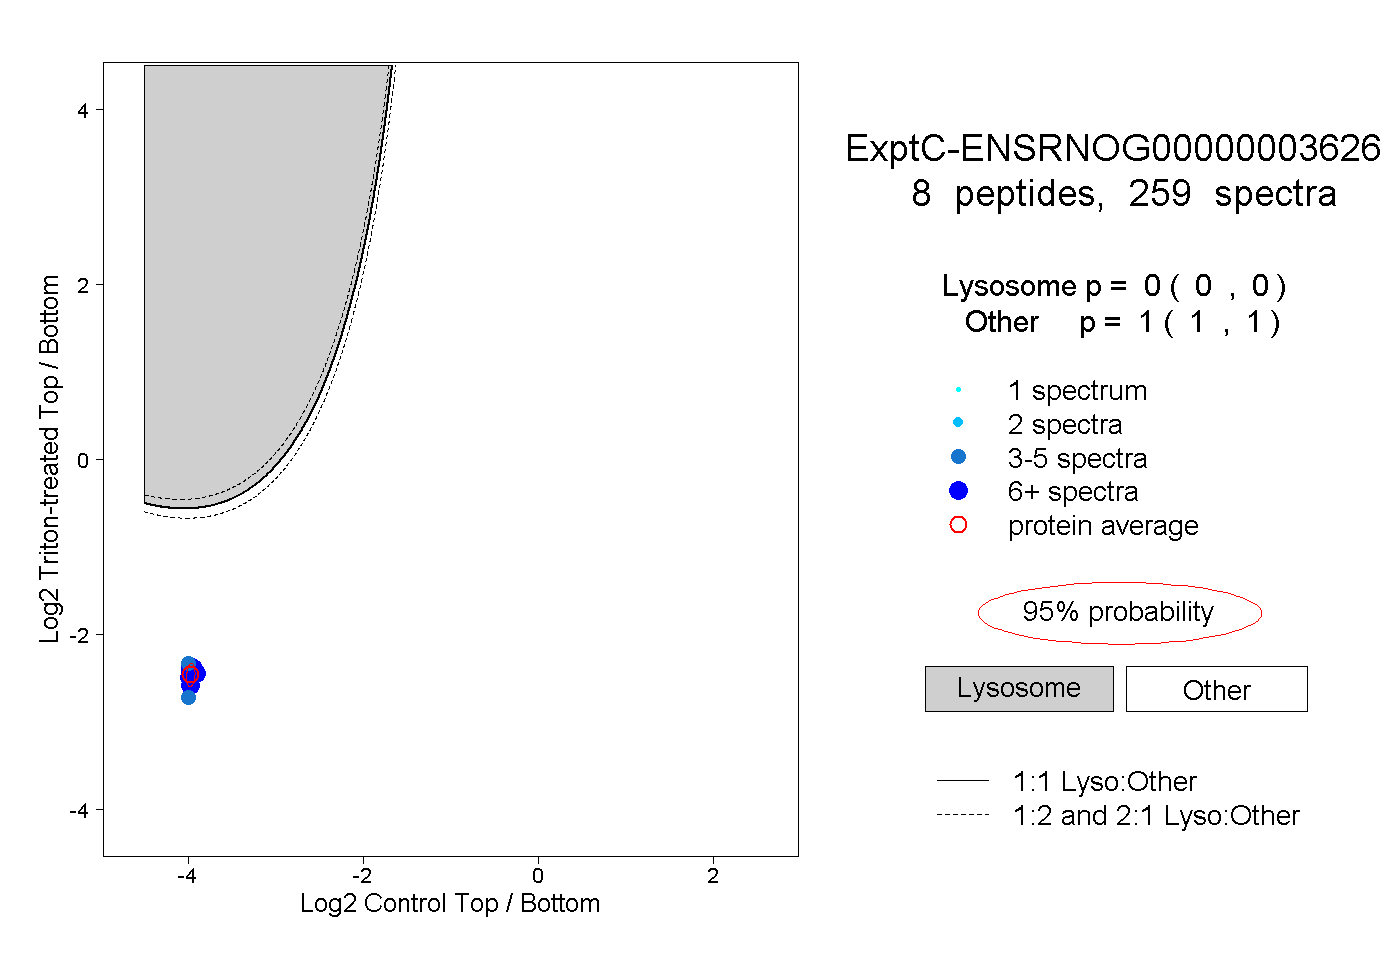 |
0.000 0.000 | 0.000 |
1.000 1.000 | 1.000 |
||||||||
| Plot | Lyso | Other | |||||||||||
| Expt D |
6 peptides |
21 spectra |
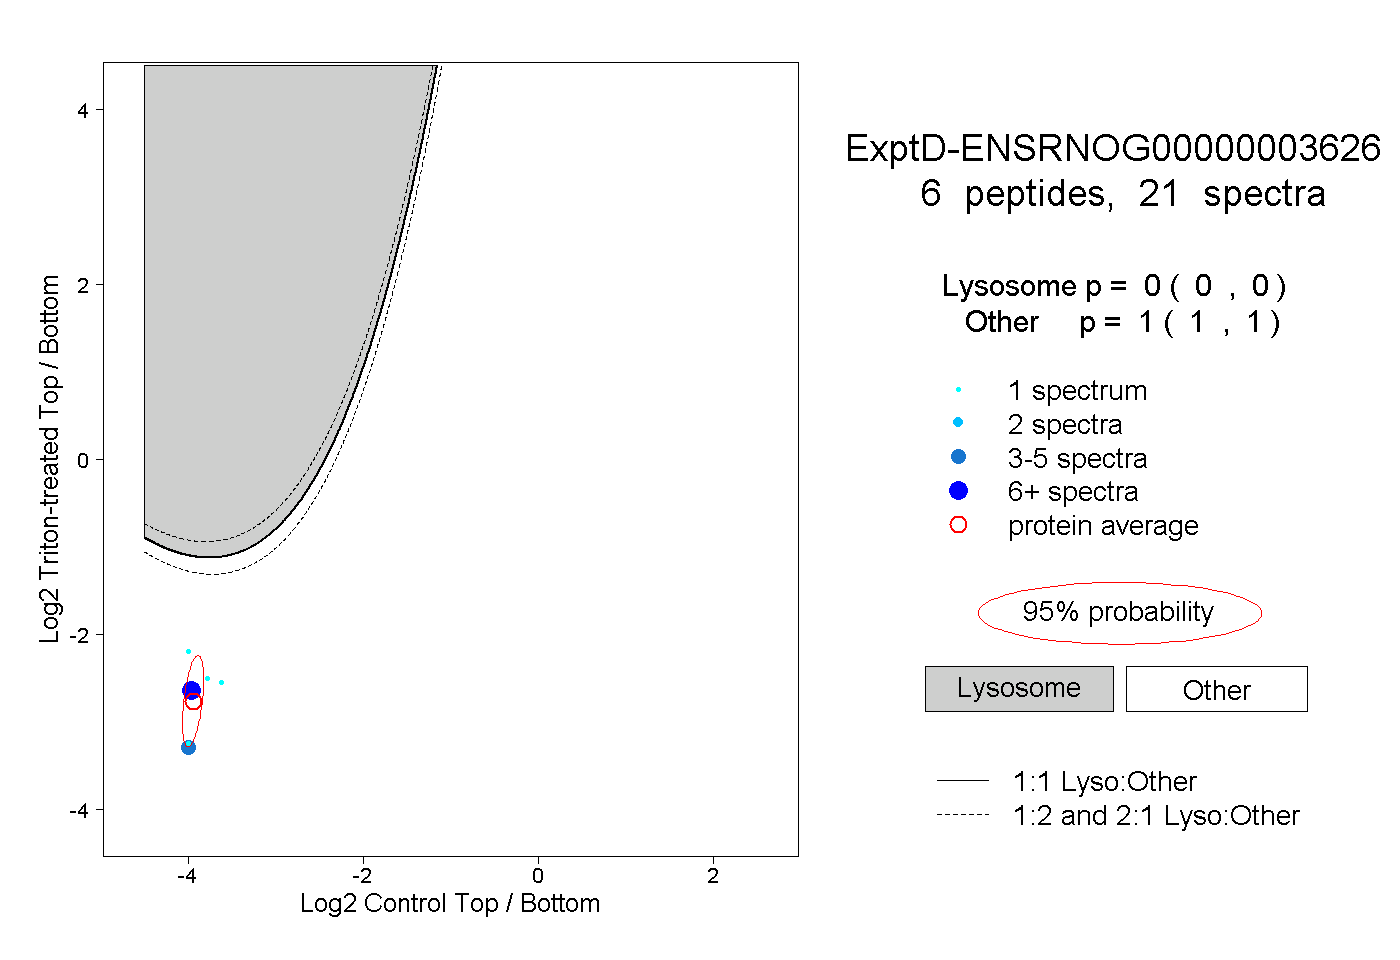 |
0.000 0.000 | 0.000 |
1.000 1.000 | 1.000 |