5
5peptides
spectra
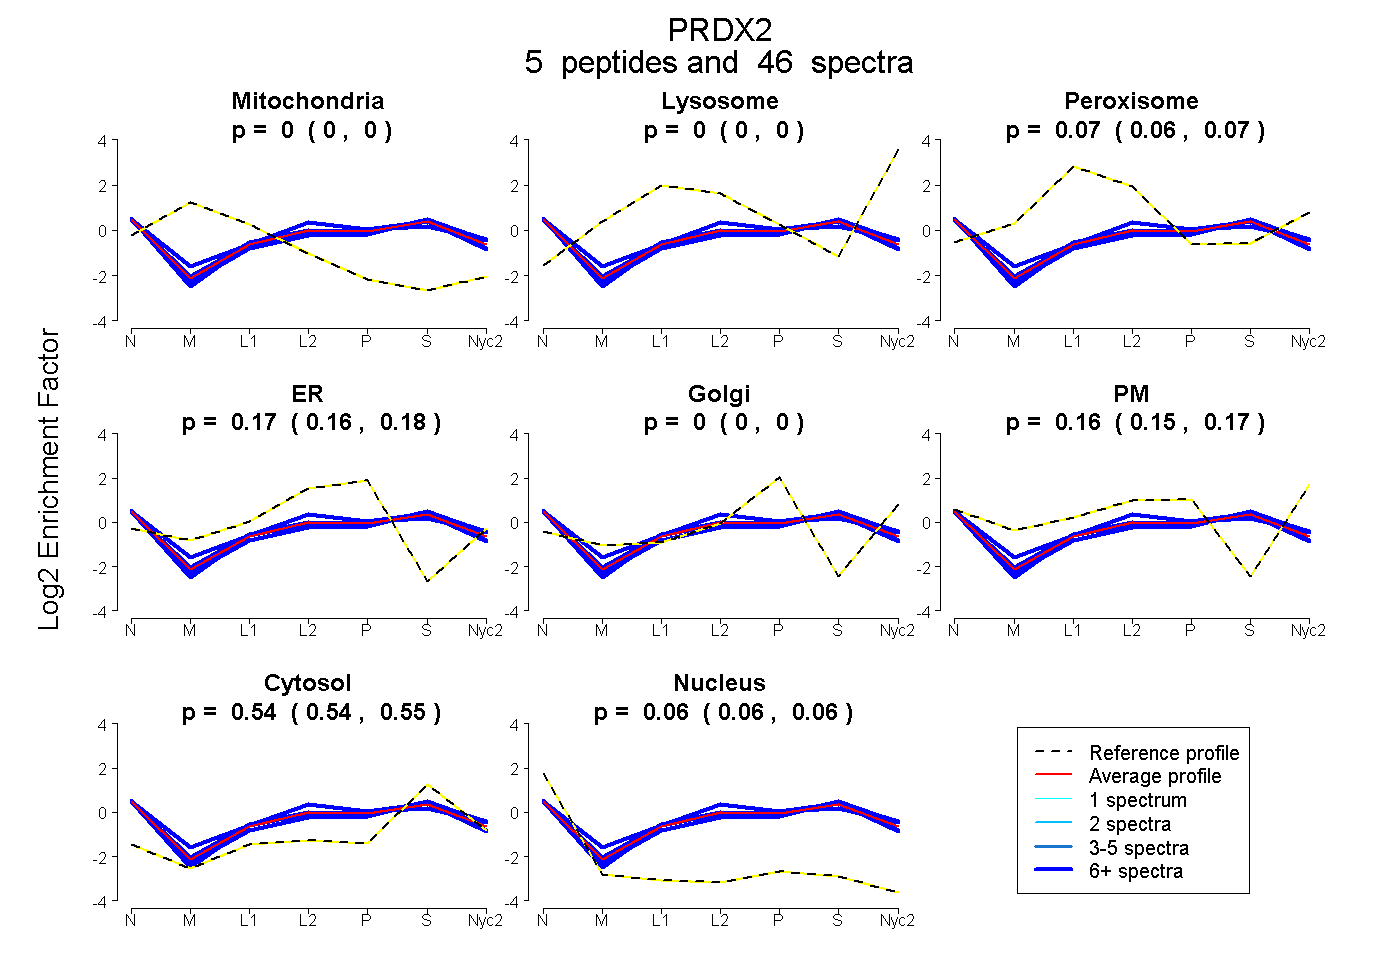
0.000 | 0.000
0.000 | 0.000
0.059 | 0.071
0.157 | 0.175
0.000 | 0.000
0.151 | 0.174
0.538 | 0.546
0.058 | 0.064
6peptides
spectra
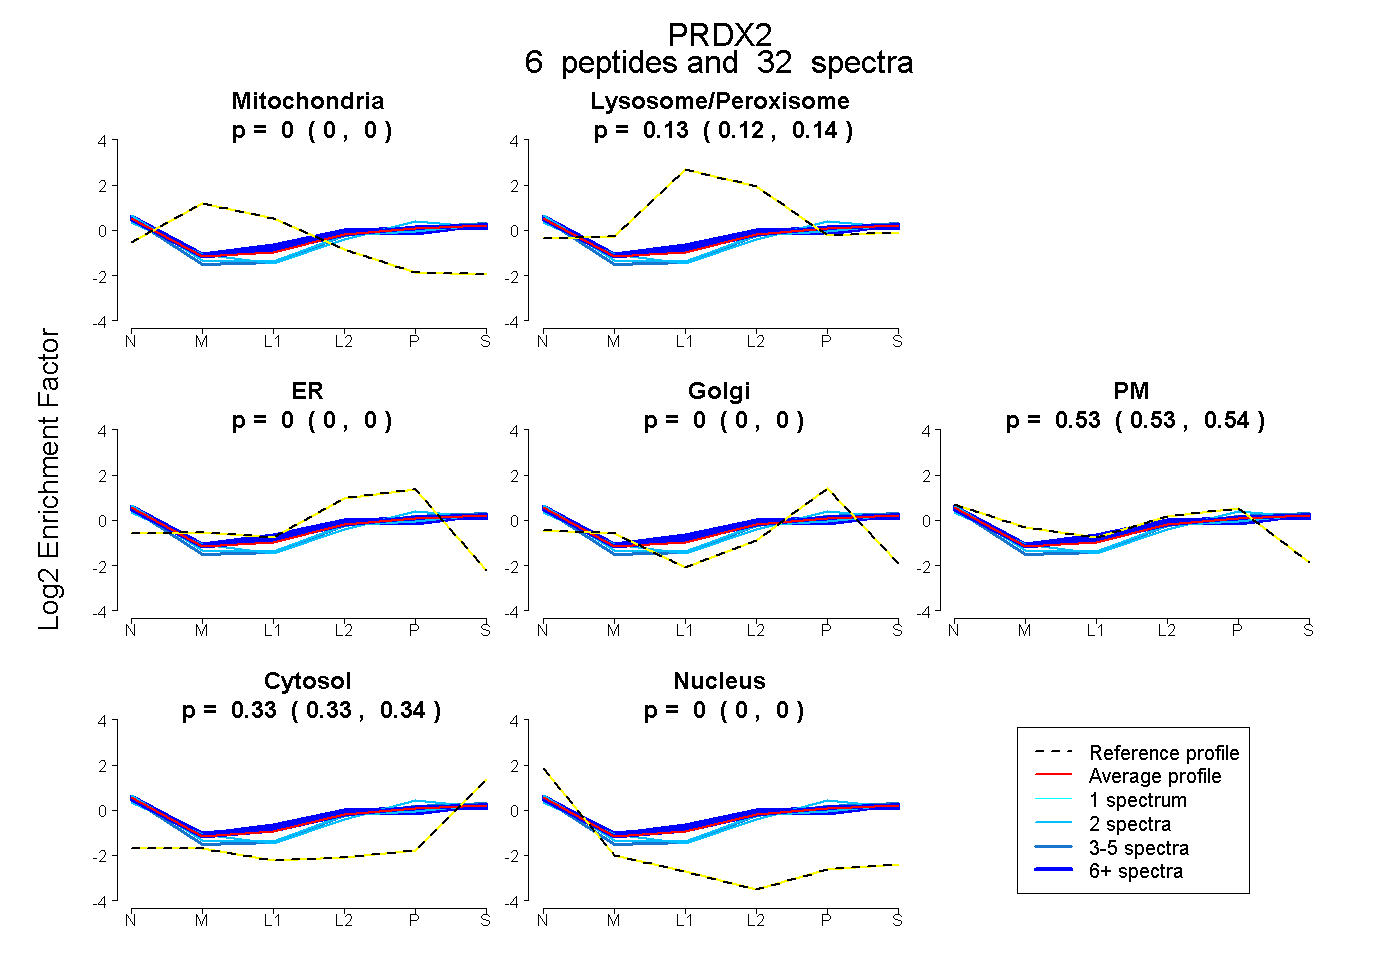
0.000 | 0.000
0.124 | 0.139
0.000 | 0.000
0.000 | 0.000
0.529 | 0.540
0.329 | 0.336
0.000 | 0.000