 5
5peptides
spectra
0.000 | 0.000
0.000 | 0.000
0.059 | 0.071
0.157 | 0.175
0.000 | 0.000
0.151 | 0.174
0.538 | 0.546
0.058 | 0.064
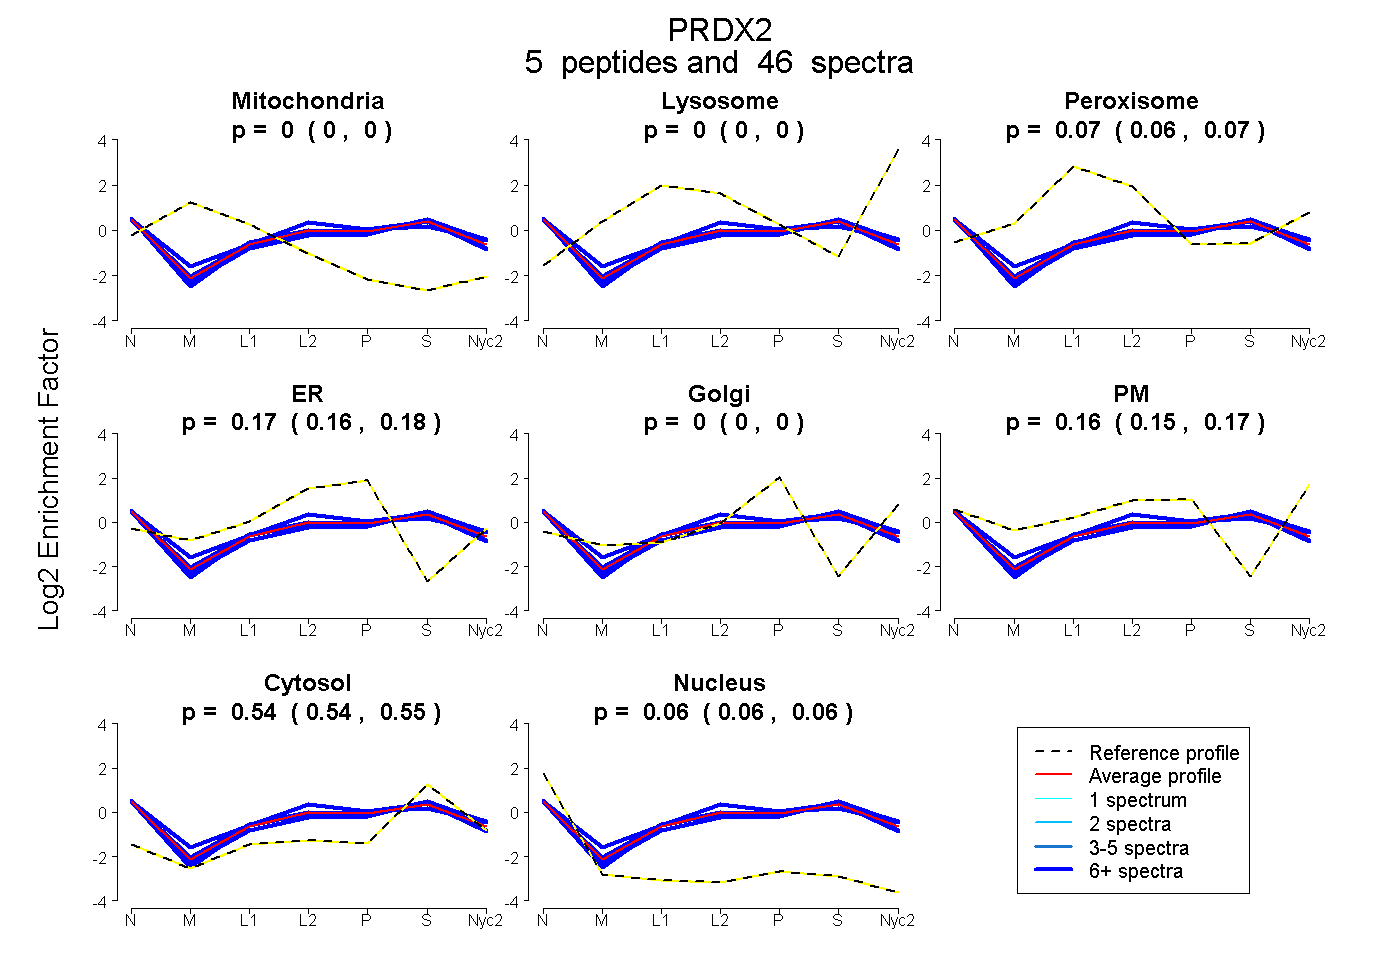
| Plot | Mito | Lyso | Perox | ER | Golgi | PM | Cytosol | Nucleus | |||||
| Expt A |
5 peptides |
46 spectra |
|
0.000 0.000 | 0.000 |
0.000 0.000 | 0.000 |
0.066 0.059 | 0.071 |
0.167 0.157 | 0.175 |
0.000 0.000 | 0.000 |
0.164 0.151 | 0.174 |
0.542 0.538 | 0.546 |
0.061 0.058 | 0.064 |
| 12 spectra, SVDEALR | 0.000 | 0.000 | 0.102 | 0.231 | 0.000 | 0.060 | 0.521 | 0.085 | ||
| 12 spectra, QITVNDLPVGR | 0.000 | 0.000 | 0.042 | 0.163 | 0.000 | 0.129 | 0.580 | 0.085 | ||
| 10 spectra, NDEGIAYR | 0.000 | 0.000 | 0.096 | 0.188 | 0.000 | 0.203 | 0.468 | 0.045 | ||
| 6 spectra, GLFIIDAK | 0.000 | 0.000 | 0.036 | 0.115 | 0.000 | 0.213 | 0.592 | 0.043 | ||
| 6 spectra, SLSQNYGVLK | 0.000 | 0.000 | 0.045 | 0.119 | 0.000 | 0.239 | 0.561 | 0.035 |
| Plot | Mito | Lyso or Perox | ER | Golgi | PM | Cytosol | Nucleus | ||||||
| Expt B |
6 peptides |
32 spectra |
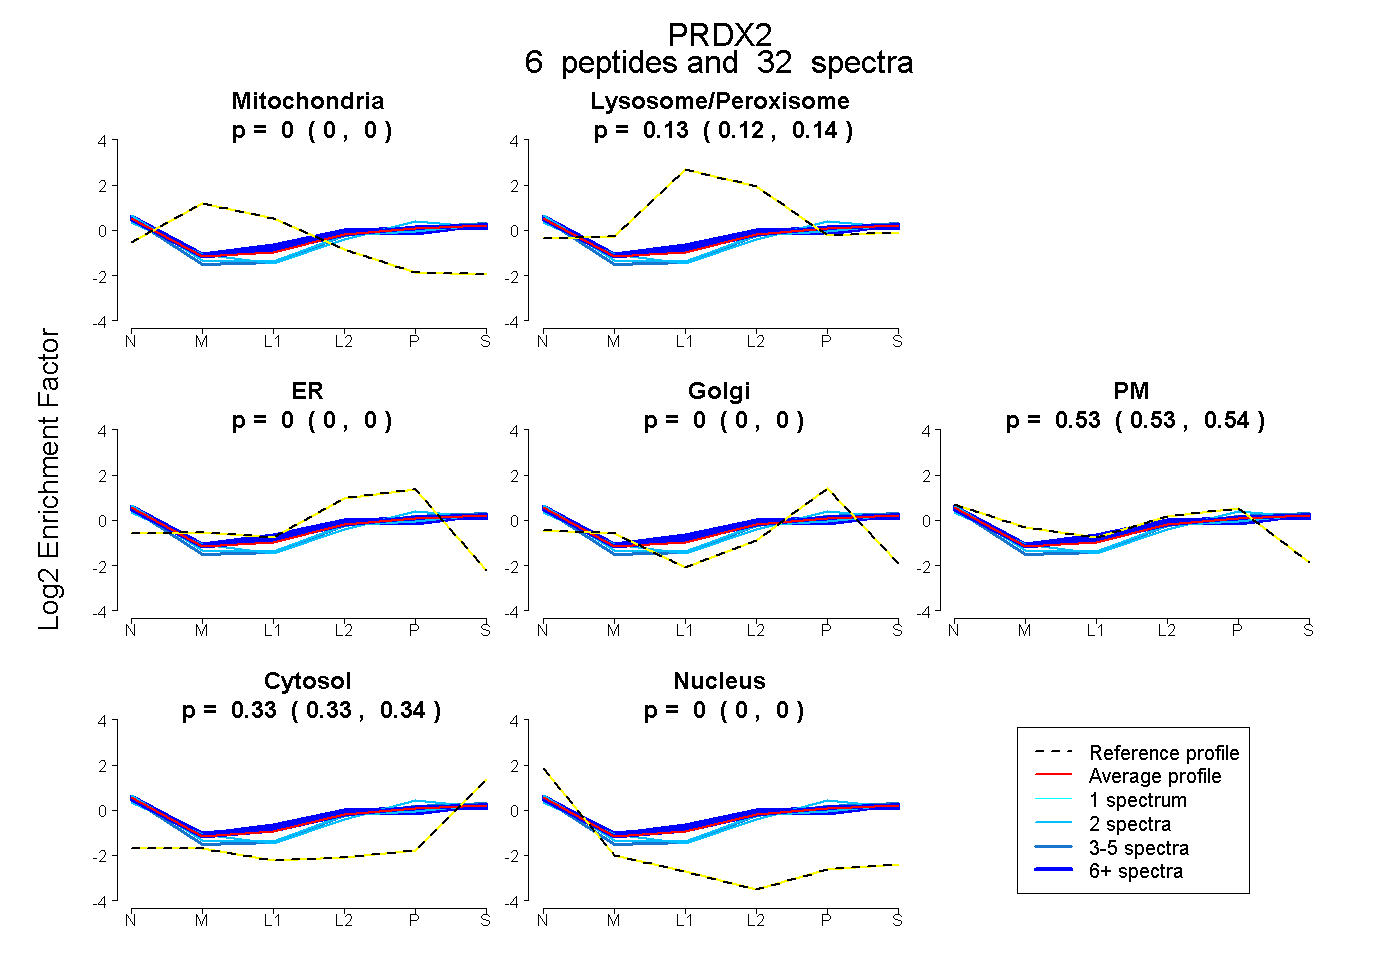 |
0.000 0.000 | 0.000 |
0.132 0.124 | 0.139 |
0.000 0.000 | 0.000 |
0.000 0.000 | 0.000 |
0.535 0.529 | 0.540 |
0.333 0.329 | 0.336 |
0.000 0.000 | 0.000 |
|||
| Plot | Lyso | Other | |||||||||||
| Expt C |
5 peptides |
124 spectra |
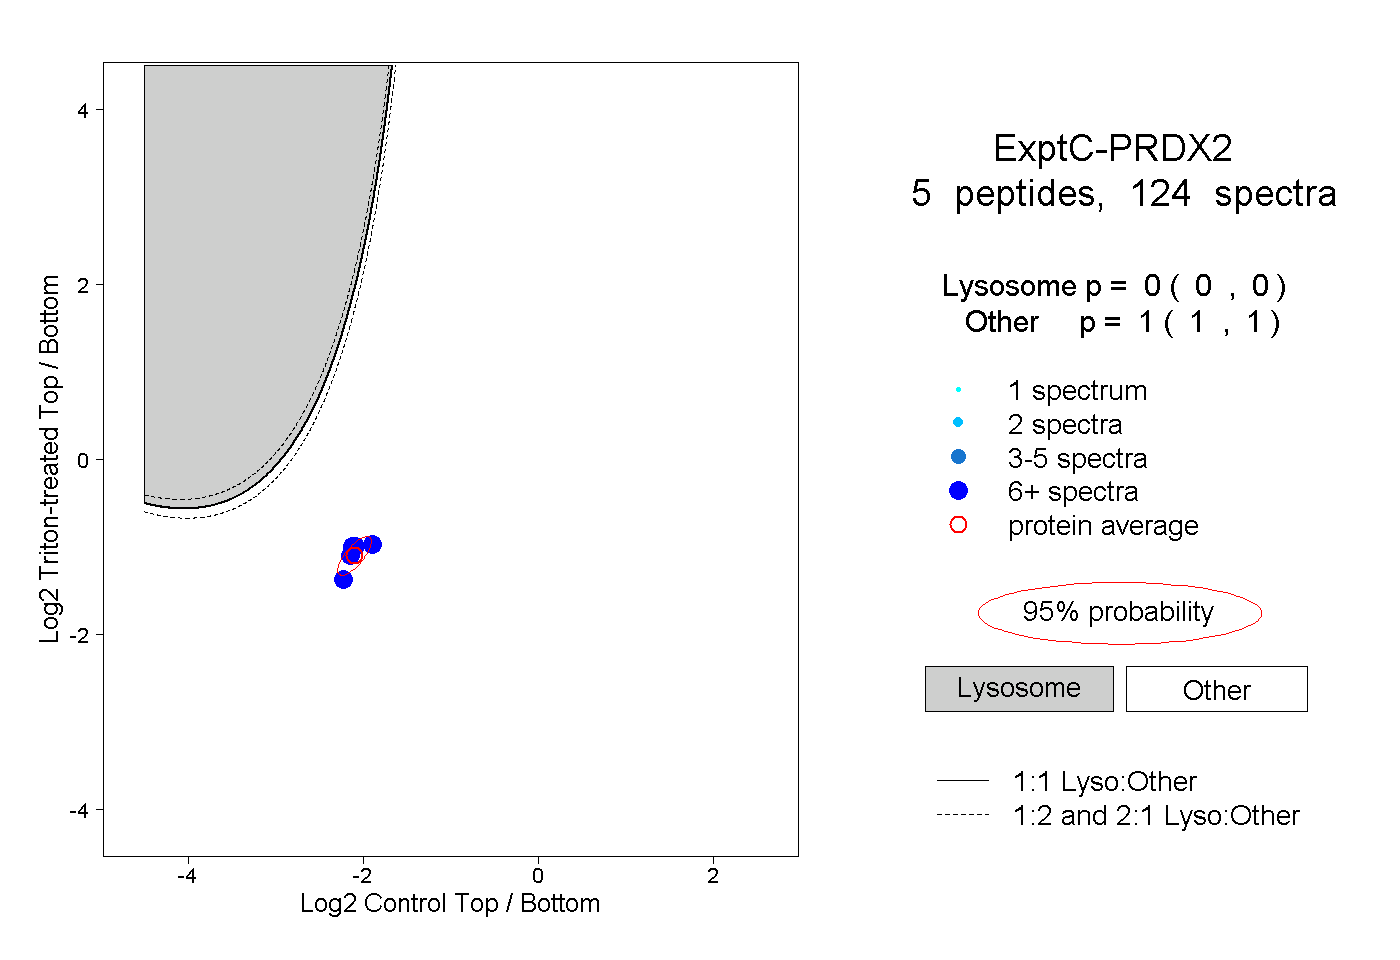 |
0.000 0.000 | 0.000 |
1.000 1.000 | 1.000 |
||||||||
| Plot | Lyso | Other | |||||||||||
| Expt D |
4 peptides |
13 spectra |
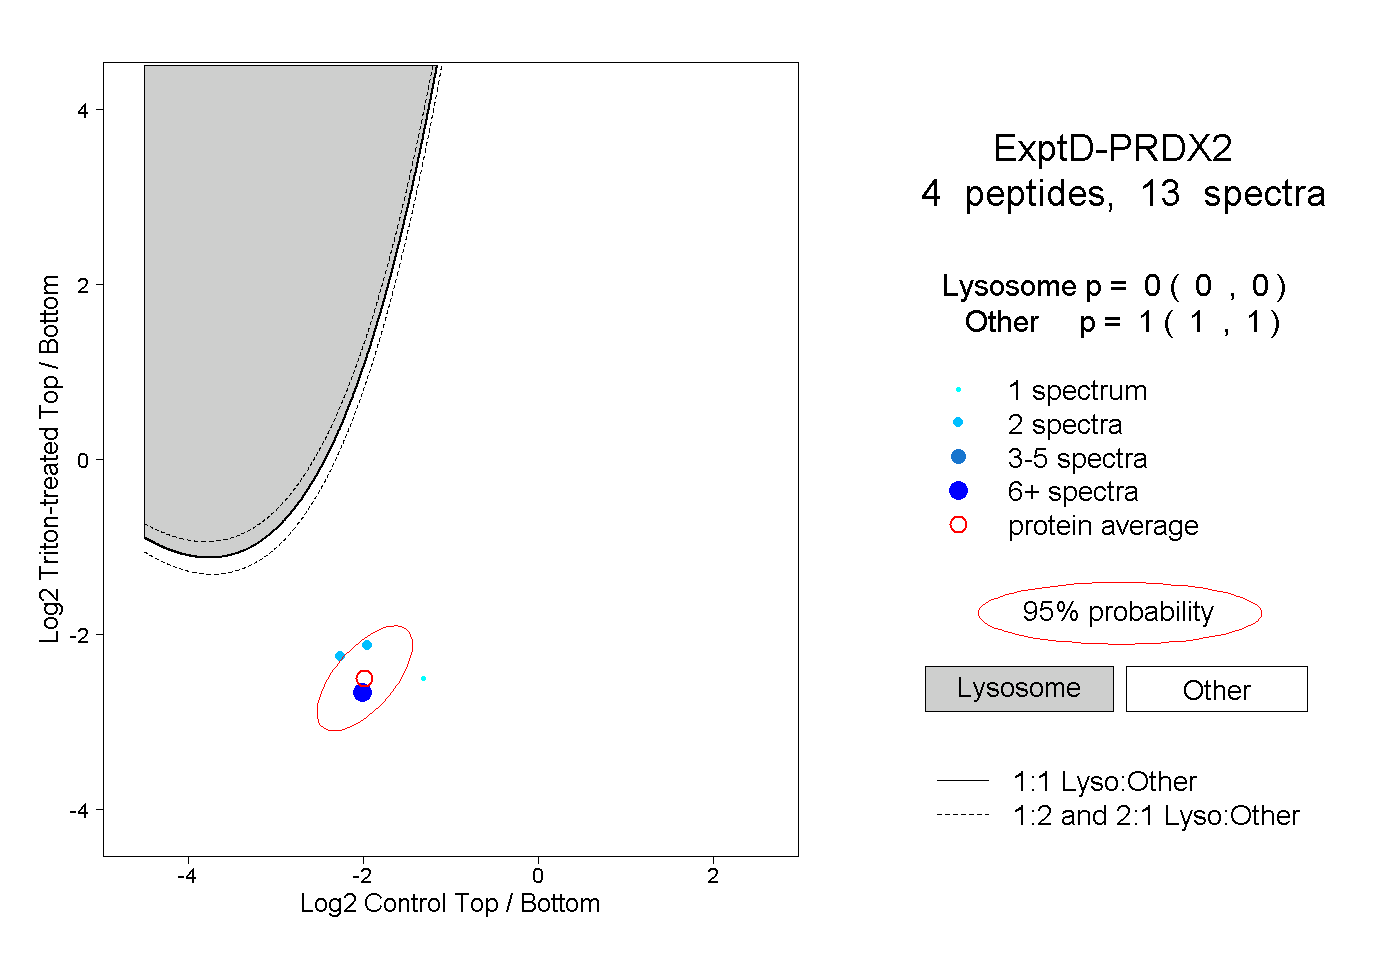 |
0.000 0.000 | 0.000 |
1.000 1.000 | 1.000 |