 2
2peptides
spectra
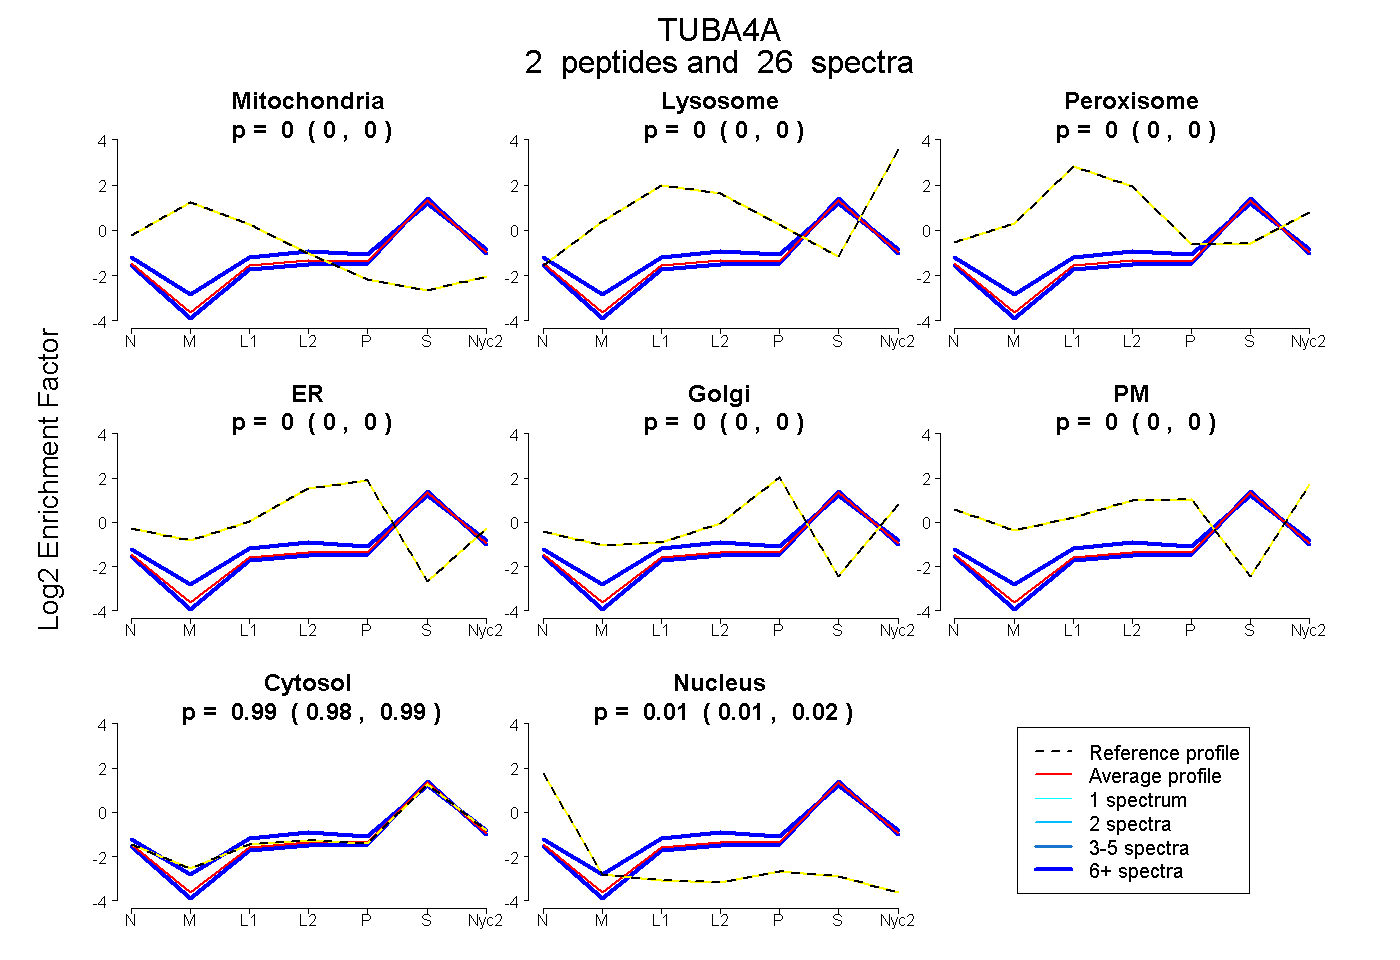
0.000 | 0.000
0.000 | 0.000
0.000 | 0.000
0.000 | 0.000
0.000 | 0.000
0.000 | 0.000
0.984 | 0.991
0.008 | 0.015
6peptides
spectra
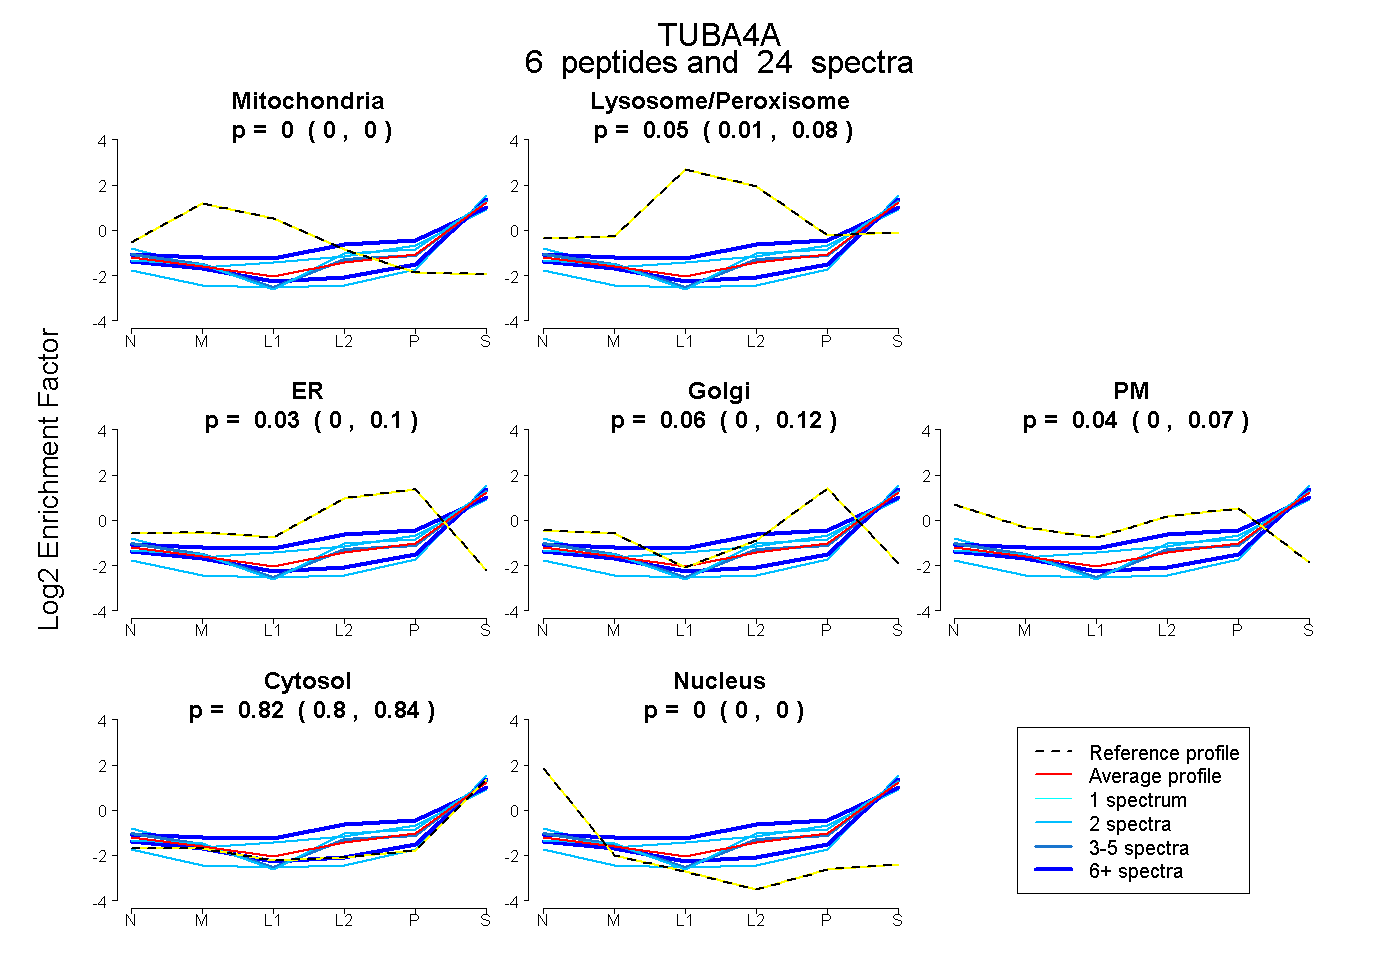
0.000 | 0.000
0.014 | 0.075
0.000 | 0.104
0.000 | 0.121
0.000 | 0.074
0.801 | 0.840
0.000 | 0.000
4peptides
spectra
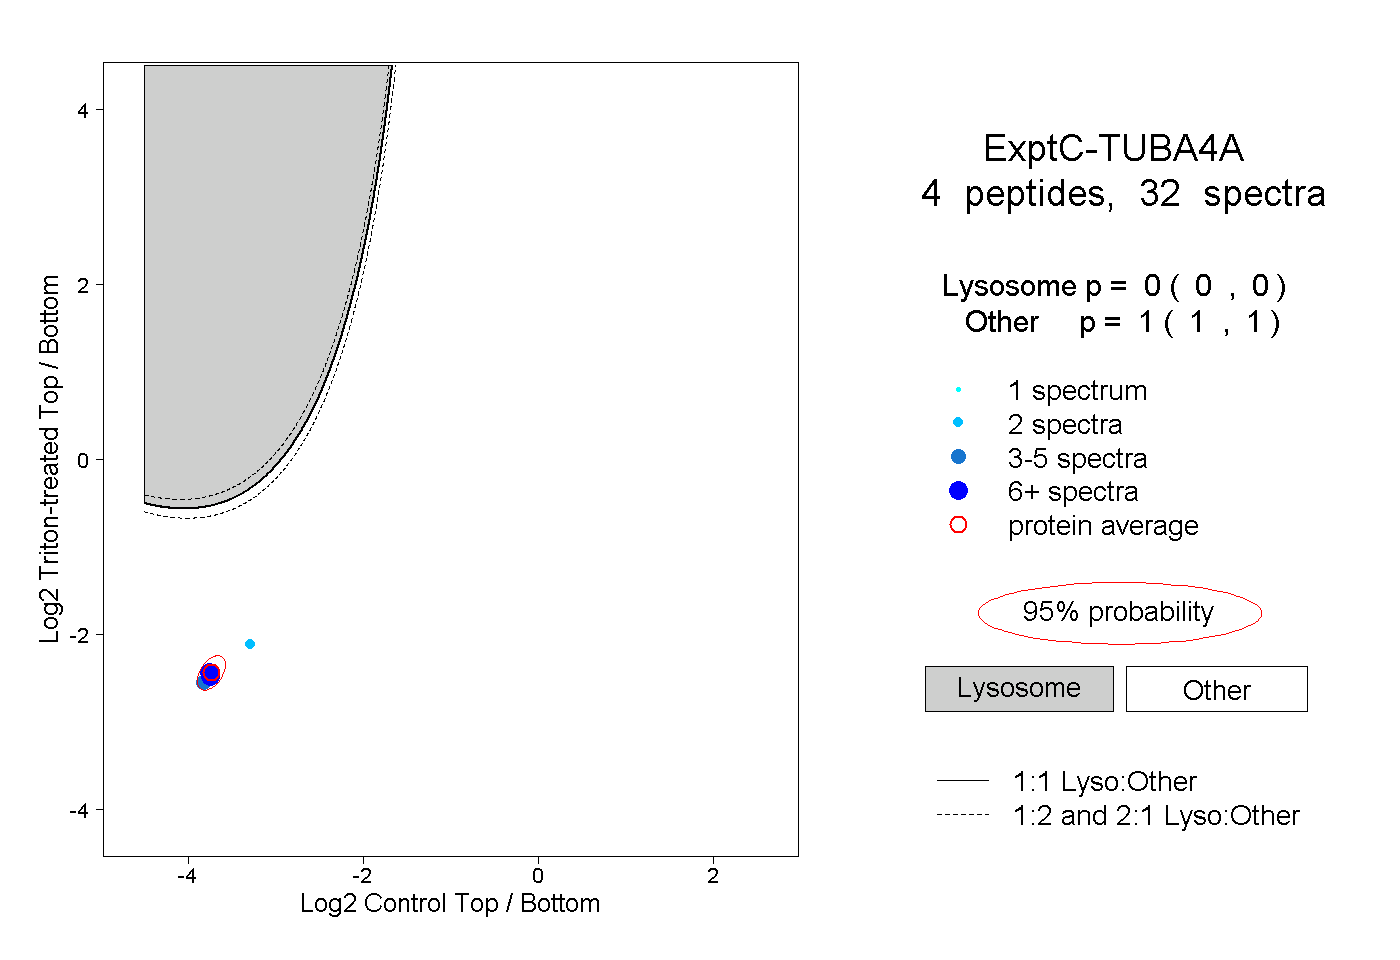
0.000 | 0.000
1.000 | 1.000
2peptides
spectra
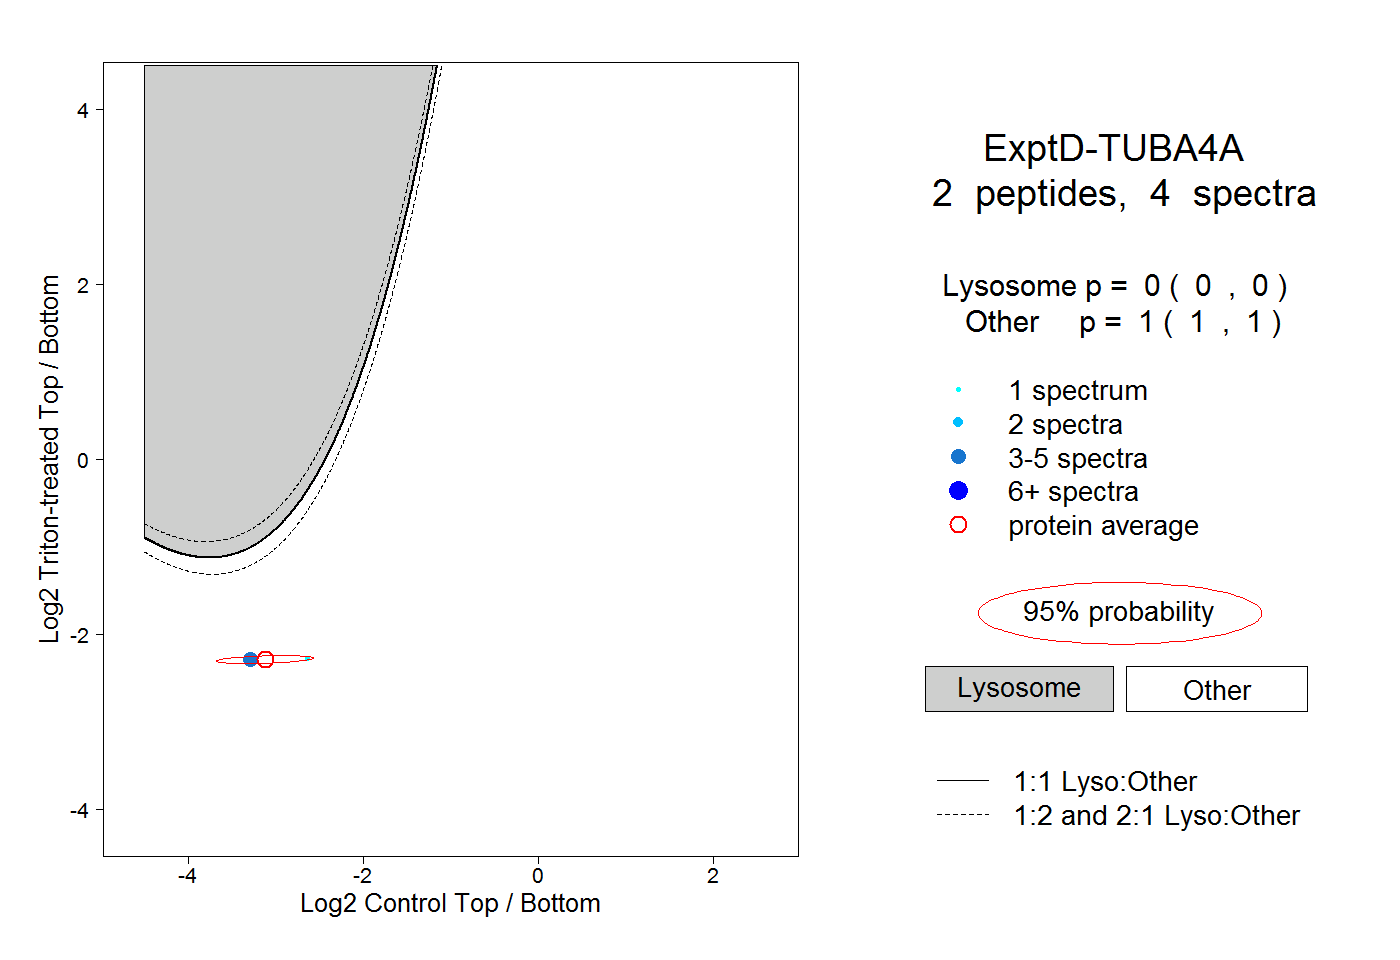
0.000 | 0.000
1.000 | 1.000