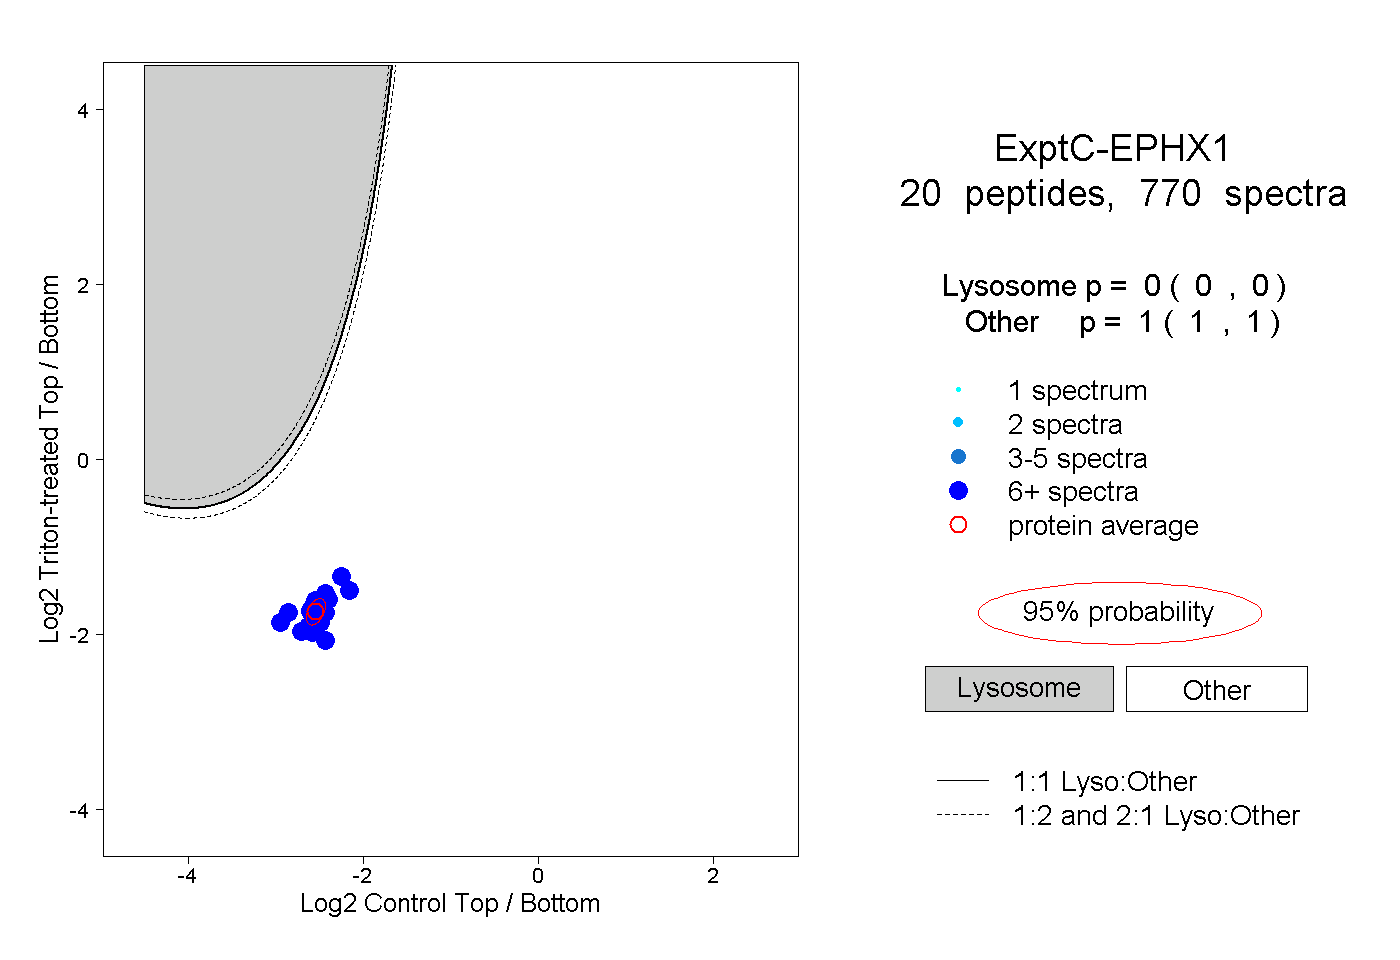
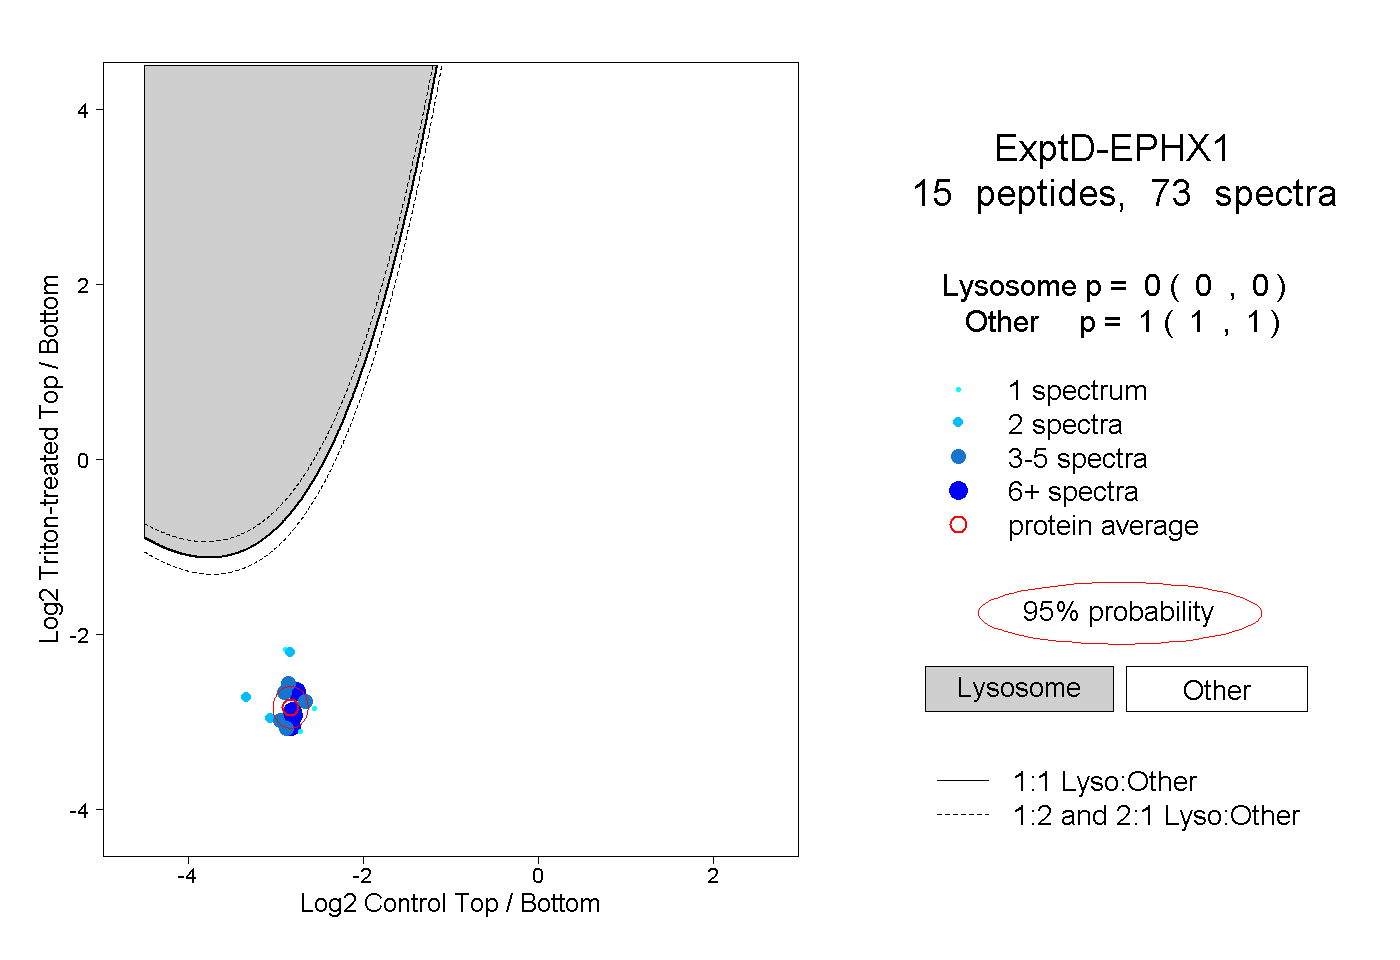
EPHX1
[ENSRNOP00000004780]
Main page
| | | Plot |
Mito |
Lyso |
|
Perox |
ER |
Golgi |
PM |
Cytosol |
Nucleus |
|
| Expt A |
 22
22
peptides |
581
spectra |
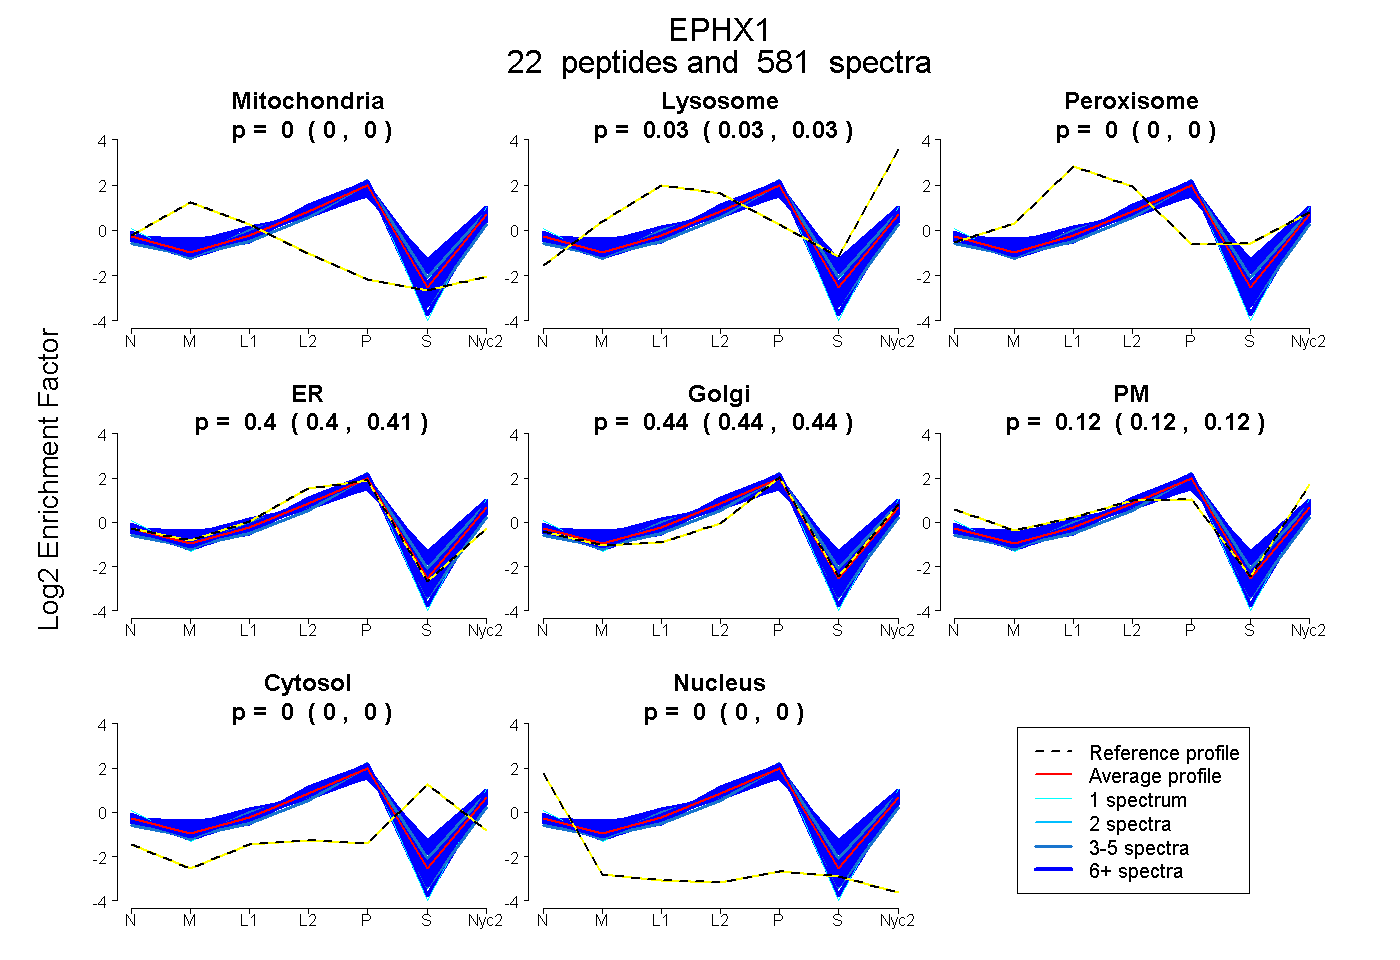 |
0.000
0.000 | 0.000 |
0.034
0.032 | 0.035 |
|
0.000
0.000 | 0.000 |
0.404
0.403 | 0.406 |
0.443
0.441 | 0.444 |
0.119
0.117 | 0.121 |
0.000
0.000 | 0.000 |
0.000
0.000 | 0.000 |
|
| | | Plot |
Mito |
|
Lyso or Perox |
|
ER |
Golgi |
PM |
Cytosol |
Nucleus |
|
| Expt B |
19
peptides |
212
spectra |
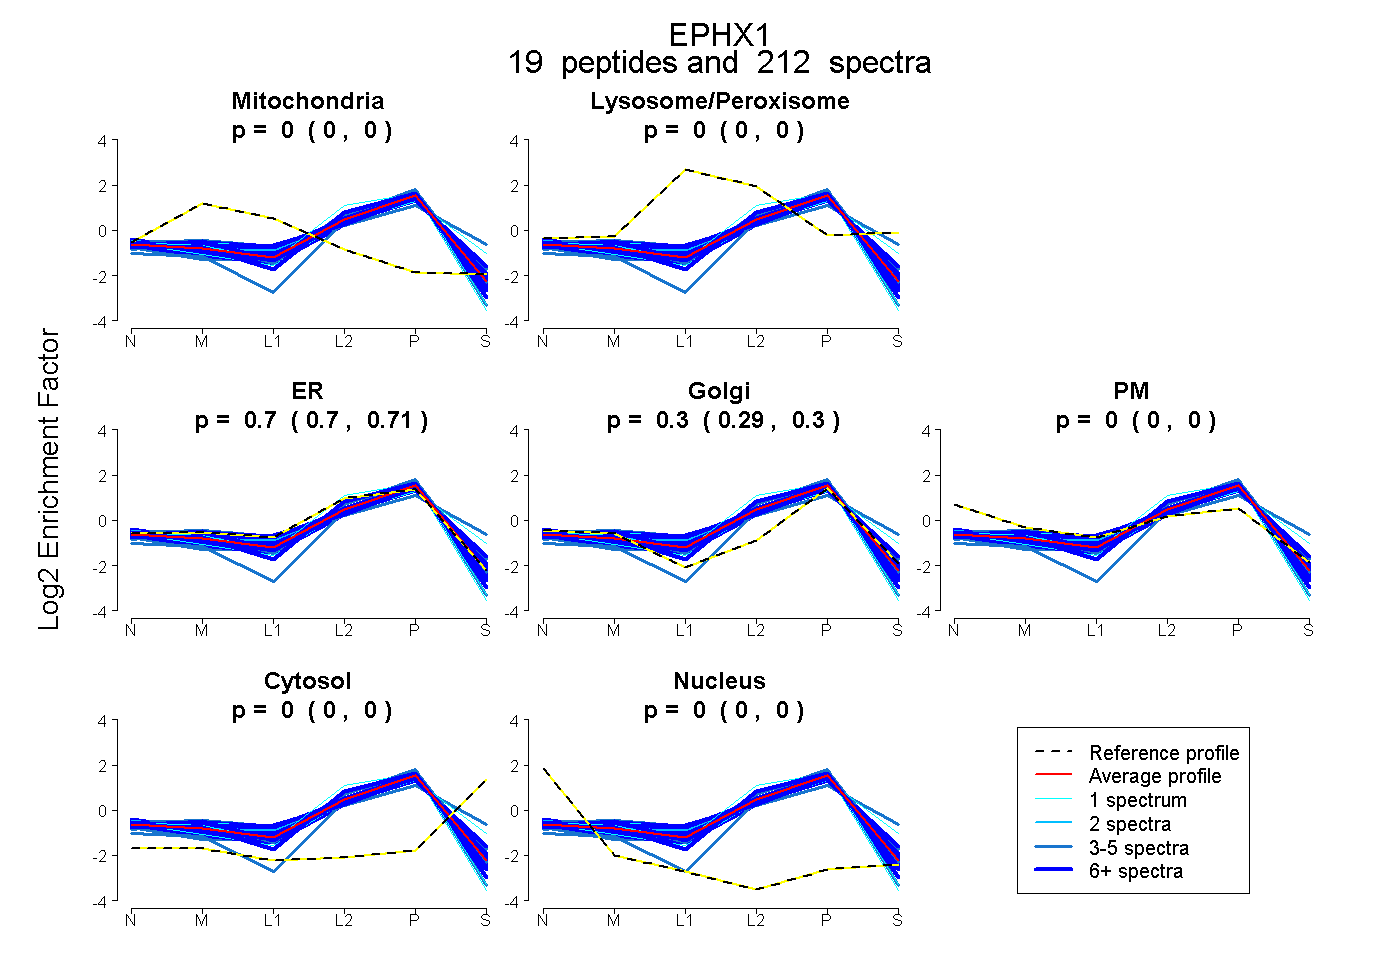 |
0.000
0.000 | 0.000 |
|
0.000
0.000 | 0.000 |
|
0.704
0.699 | 0.708 |
0.296
0.292 | 0.300 |
0.000
0.000 | 0.000 |
0.000
0.000 | 0.000 |
0.000
0.000 | 0.000 |
|
| | | Plot |
|
Lyso |
|
|
|
|
|
|
|
Other |
| Expt C |
20
peptides |
770
spectra |
 |
|
0.000
0.000 | 0.000 |
|
|
|
|
|
|
|
1.000
1.000 | 1.000 |
| | | Plot |
|
Lyso |
|
|
|
|
|
|
|
Other |
| Expt D |
15
peptides |
73
spectra |
 |
|
0.000
0.000 | 0.000 |
|
|
|
|
|
|
|
1.000
1.000 | 1.000 |
| 1 spectrum, DIELLYPYK |
|
0.000 |
|
|
|
|
|
|
|
1.000 |
| 15 spectra, ASPPLEGSR |
|
0.000 |
|
|
|
|
|
|
|
1.000 |
| 1 spectrum, FVSLAELQ |
|
0.000 |
|
|
|
|
|
|
|
1.000 |
| 4 spectra, QVEILNQYPHFK |
|
0.000 |
|
|
|
|
|
|
|
1.000 |
| 3 spectra, GGHFAAFEEPK |
|
0.000 |
|
|
|
|
|
|
|
1.000 |
| 5 spectra, LLAQDIR |
|
0.000 |
|
|
|
|
|
|
|
1.000 |
| 9 spectra, FLGYTEK |
|
0.000 |
|
|
|
|
|
|
|
1.000 |
| 7 spectra, ELEDGGLER |
|
0.000 |
|
|
|
|
|
|
|
1.000 |
| 12 spectra, GLNSVATAR |
|
0.000 |
|
|
|
|
|
|
|
1.000 |
| 2 spectra, LISYSYMER |
|
0.000 |
|
|
|
|
|
|
|
1.000 |
| 2 spectra, EDESIRPFK |
|
0.000 |
|
|
|
|
|
|
|
1.000 |
| 1 spectrum, FSTWTK |
|
0.000 |
|
|
|
|
|
|
|
1.000 |
| 5 spectra, VVSYWR |
|
0.000 |
|
|
|
|
|
|
|
1.000 |
| 4 spectra, GLHLNMAFISR |
|
0.000 |
|
|
|
|
|
|
|
1.000 |
| 2 spectra, VETSDEEIK |
|
0.000 |
|
|
|
|
|
|
|
1.000 |