13
13peptides
spectra
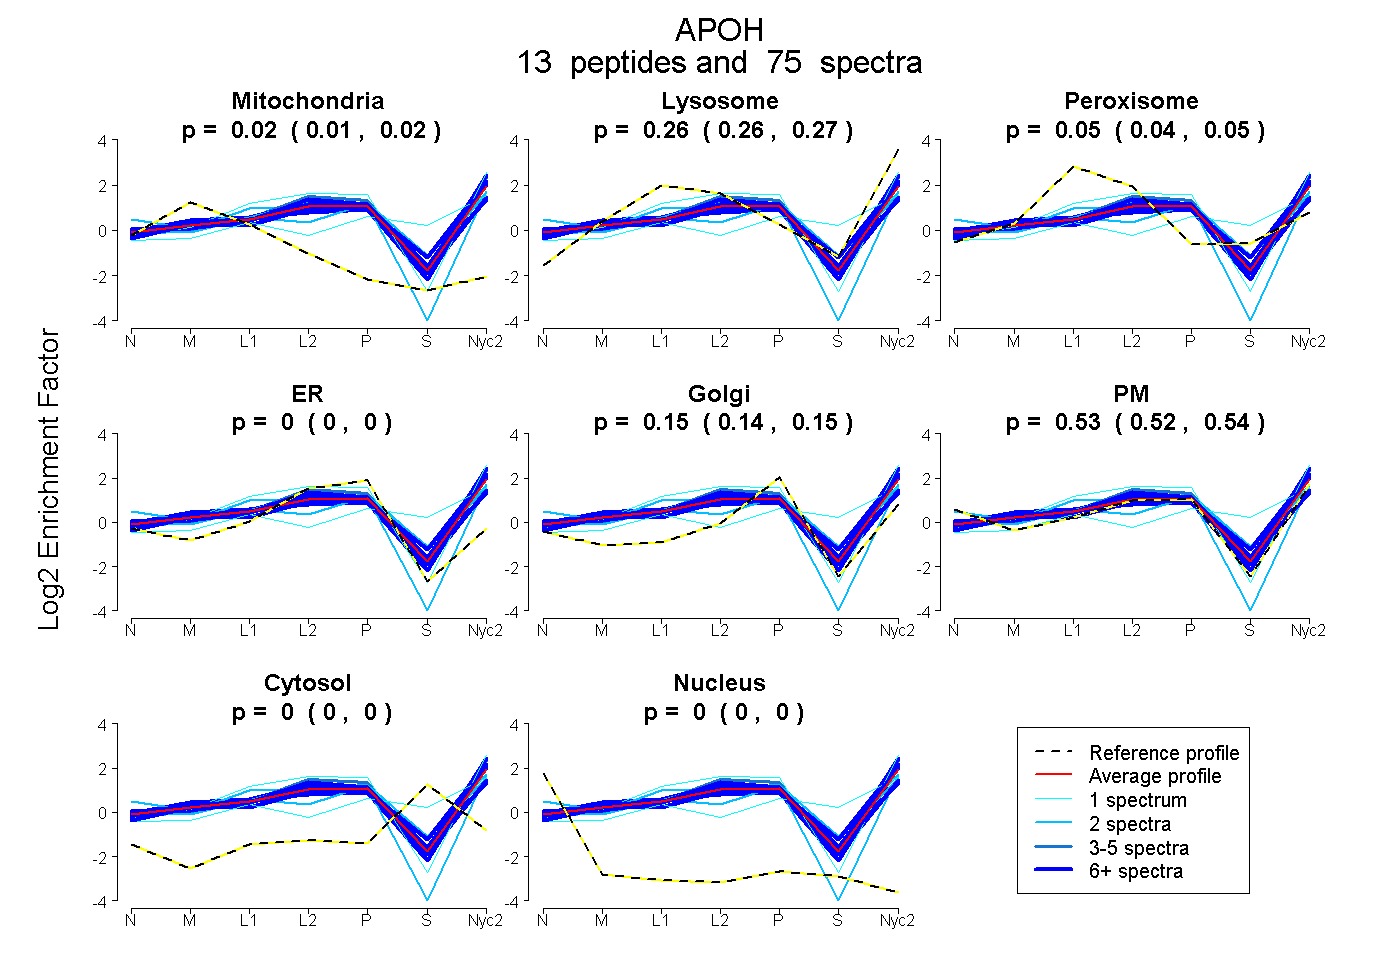
0.012 | 0.018
0.257 | 0.272
0.037 | 0.054
0.000 | 0.000
0.137 | 0.152
0.517 | 0.538
0.000 | 0.000
0.000 | 0.000
6peptides
spectra
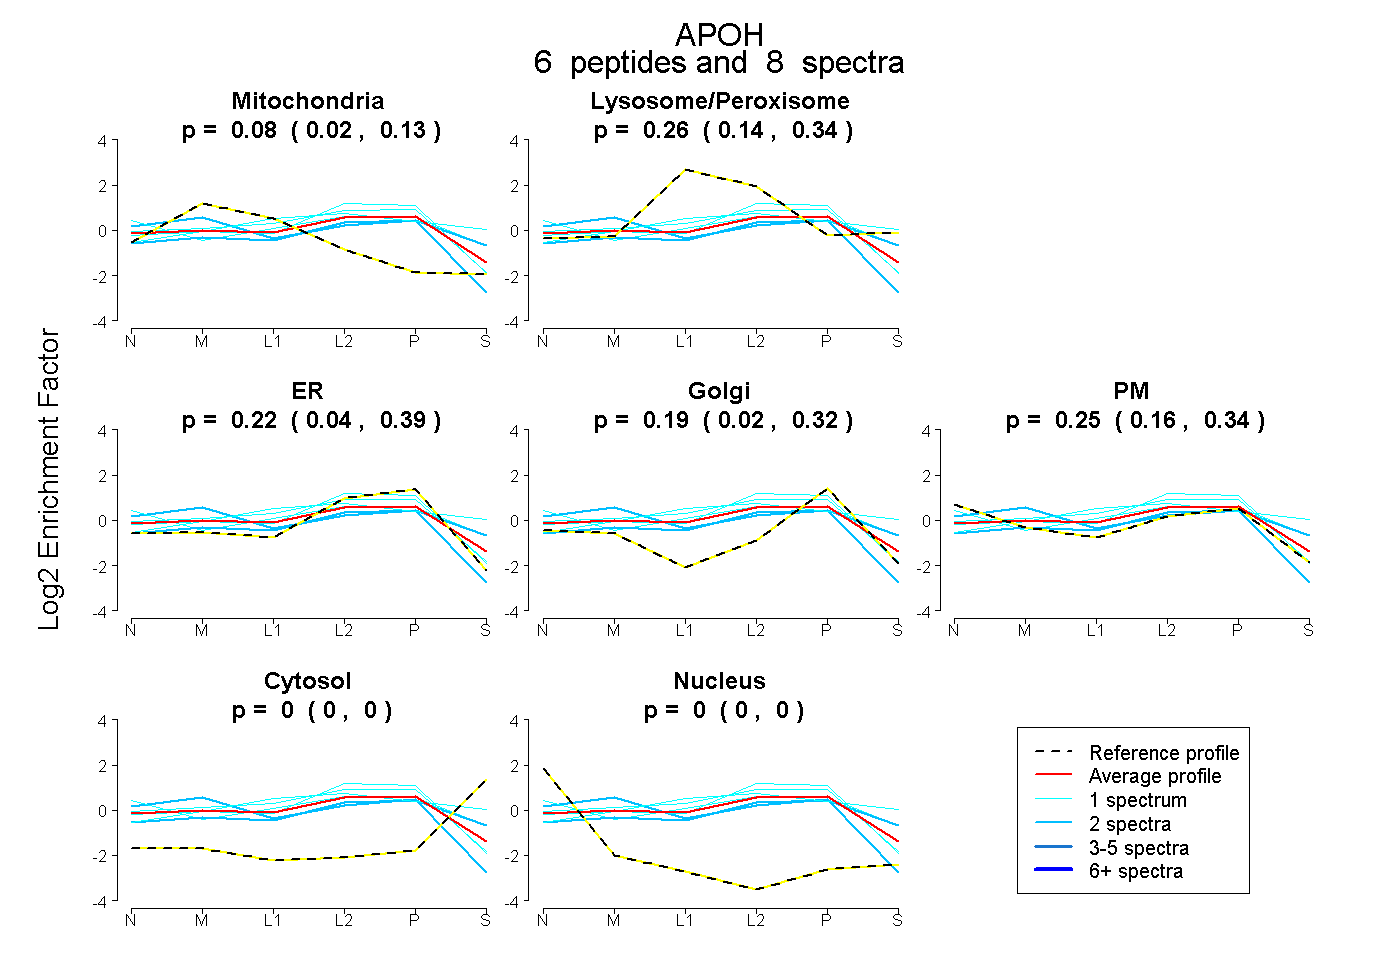
0.018 | 0.133
0.142 | 0.344
0.039 | 0.390
0.016 | 0.319
0.156 | 0.343
0.000 | 0.000
0.000 | 0.000
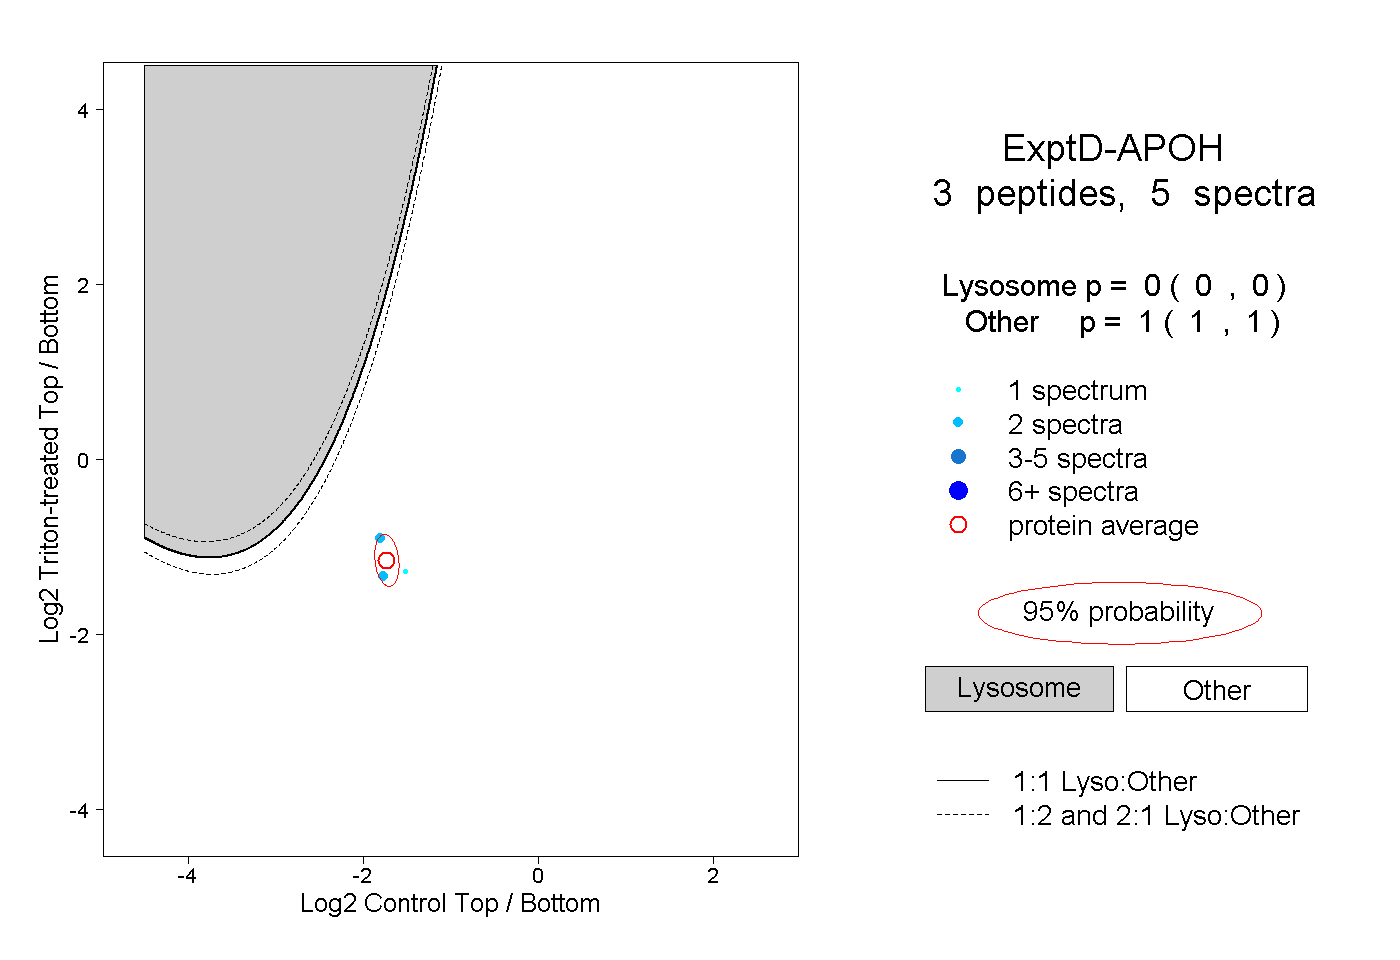
15peptides
spectra
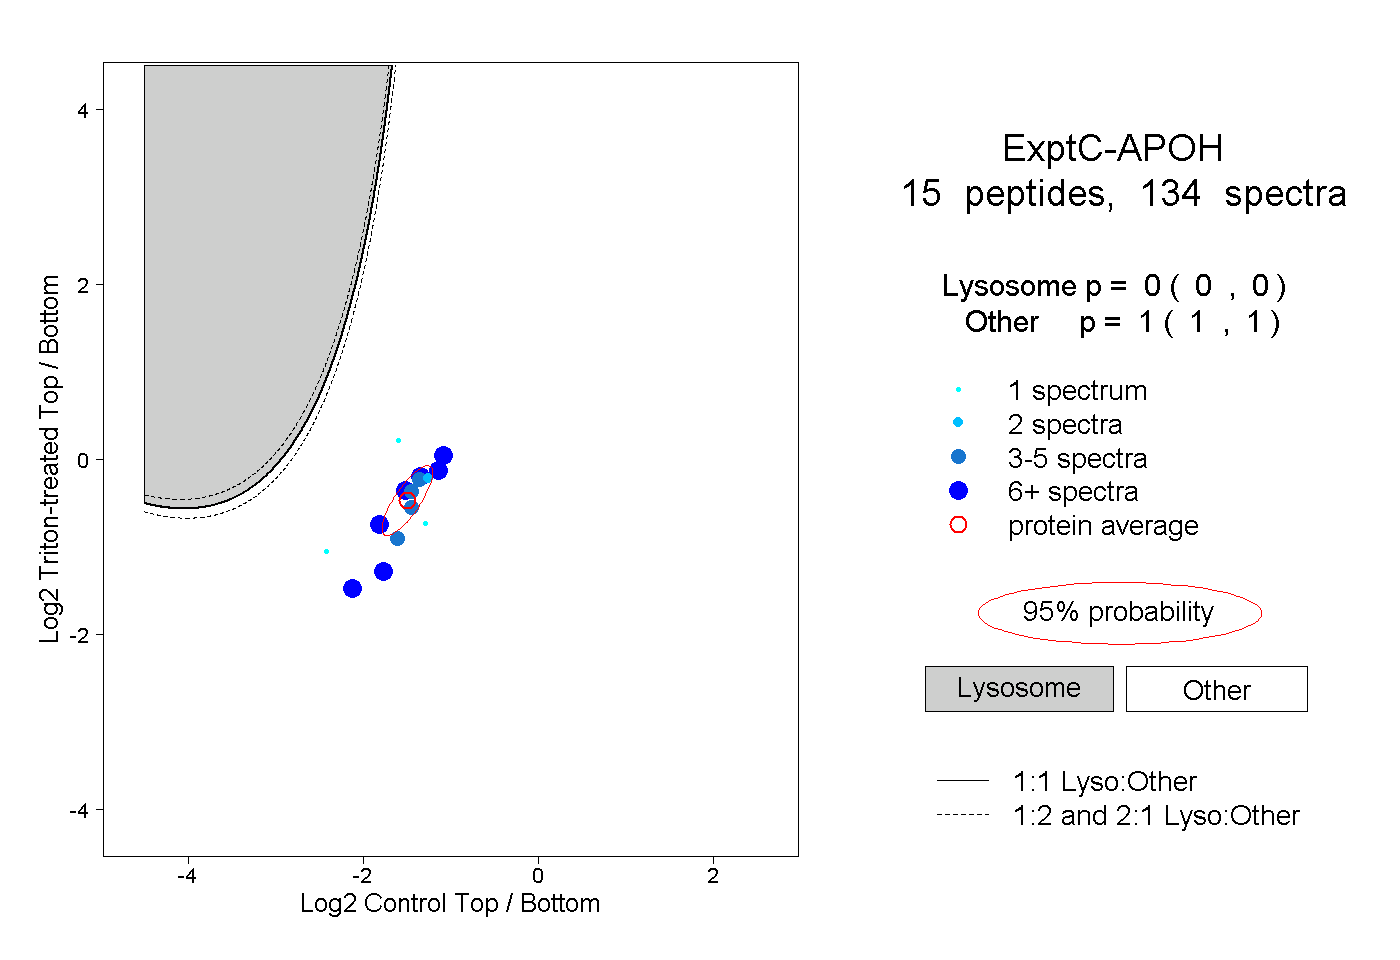
0.000 | 0.000
1.000 | 1.000