 13
13peptides
spectra
0.012 | 0.018
0.257 | 0.272
0.037 | 0.054
0.000 | 0.000
0.137 | 0.152
0.517 | 0.538
0.000 | 0.000
0.000 | 0.000
| Plot | Mito | Lyso | Perox | ER | Golgi | PM | Cytosol | Nucleus | |||||
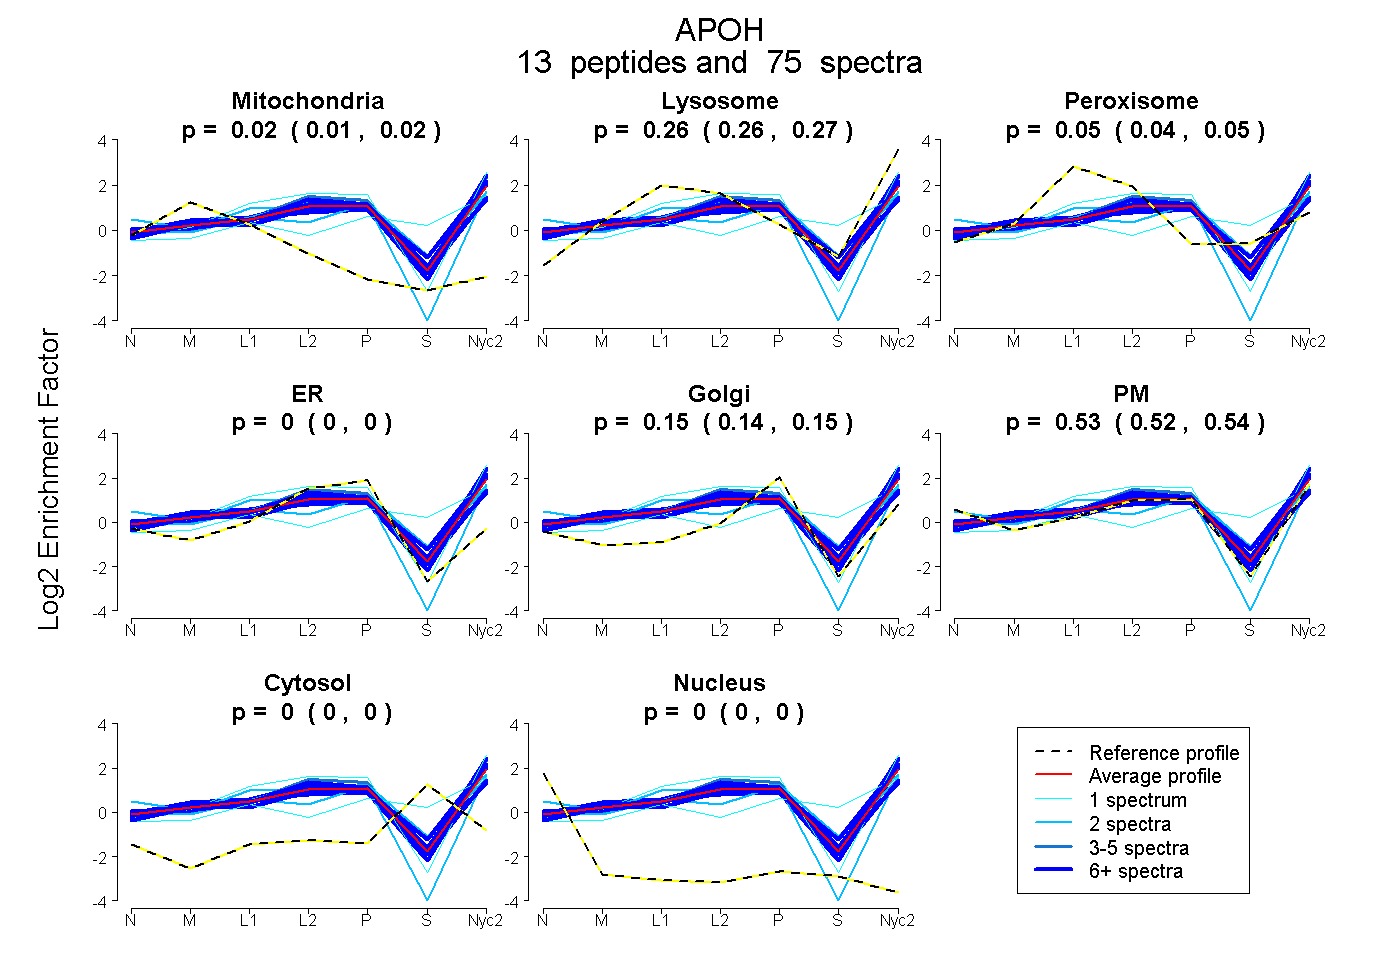
| Expt A |
13 peptides |
75 spectra |
|
0.015 0.012 | 0.018 |
0.265 0.257 | 0.272 |
0.046 0.037 | 0.054 |
0.000 0.000 | 0.000 |
0.146 0.137 | 0.152 |
0.528 0.517 | 0.538 |
0.000 0.000 | 0.000 |
0.000 0.000 | 0.000 |
| 13 spectra, LDGPEEVECTK | 0.092 | 0.213 | 0.002 | 0.075 | 0.114 | 0.505 | 0.000 | 0.000 | ||
| 6 spectra, FTCPLTGMWPINTLK | 0.000 | 0.367 | 0.045 | 0.000 | 0.060 | 0.477 | 0.050 | 0.000 | ||
| 4 spectra, CTEEGK | 0.000 | 0.319 | 0.000 | 0.063 | 0.025 | 0.592 | 0.000 | 0.000 | ||
| 1 spectrum, TCPKPDELPFAVVVPLK | 0.000 | 0.384 | 0.000 | 0.114 | 0.000 | 0.502 | 0.000 | 0.000 | ||
| 1 spectrum, VCPFAGILENGVVR | 0.000 | 0.373 | 0.006 | 0.000 | 0.096 | 0.175 | 0.350 | 0.000 | ||
| 7 spectra, ATVLYQGQR | 0.059 | 0.280 | 0.000 | 0.000 | 0.045 | 0.616 | 0.000 | 0.000 | ||
| 2 spectra, AVFGCHETYK | 0.000 | 0.206 | 0.295 | 0.000 | 0.357 | 0.142 | 0.000 | 0.000 | ||
| 10 spectra, VHFYCK | 0.051 | 0.161 | 0.165 | 0.000 | 0.272 | 0.351 | 0.000 | 0.000 | ||
| 2 spectra, EHSSLAFWK | 0.000 | 0.213 | 0.106 | 0.000 | 0.247 | 0.356 | 0.078 | 0.000 | ||
| 12 spectra, NGMMHGDK | 0.000 | 0.304 | 0.000 | 0.000 | 0.013 | 0.683 | 0.000 | 0.000 | ||
| 6 spectra, WSPELPVCAR | 0.002 | 0.360 | 0.030 | 0.039 | 0.207 | 0.361 | 0.000 | 0.000 | ||
| 9 spectra, IQDQFK | 0.011 | 0.295 | 0.000 | 0.000 | 0.078 | 0.616 | 0.000 | 0.000 | ||
| 2 spectra, ITCPPPPIPK | 0.000 | 0.000 | 0.000 | 0.060 | 0.000 | 0.940 | 0.000 | 0.000 |
| Plot | Mito | Lyso or Perox | ER | Golgi | PM | Cytosol | Nucleus | ||||||
| Expt B |
6 peptides |
8 spectra |
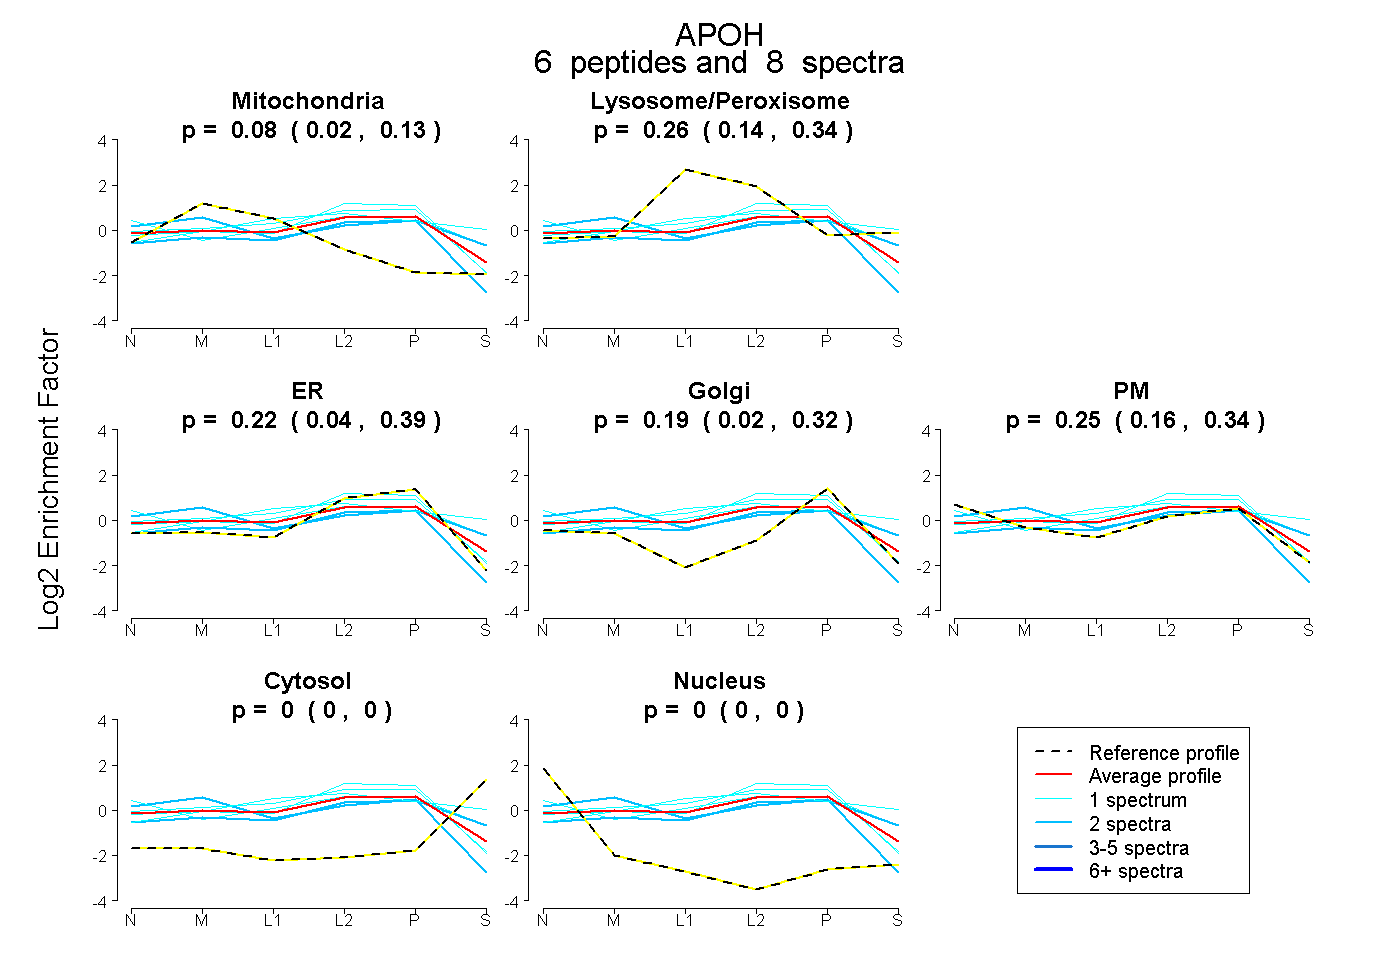 |
0.081 0.018 | 0.133 |
0.256 0.142 | 0.344 |
0.221 0.039 | 0.390 |
0.187 0.016 | 0.319 |
0.255 0.156 | 0.343 |
0.000 0.000 | 0.000 |
0.000 0.000 | 0.000 |
|||
| Plot | Lyso | Other | |||||||||||
| Expt C |
15 peptides |
134 spectra |
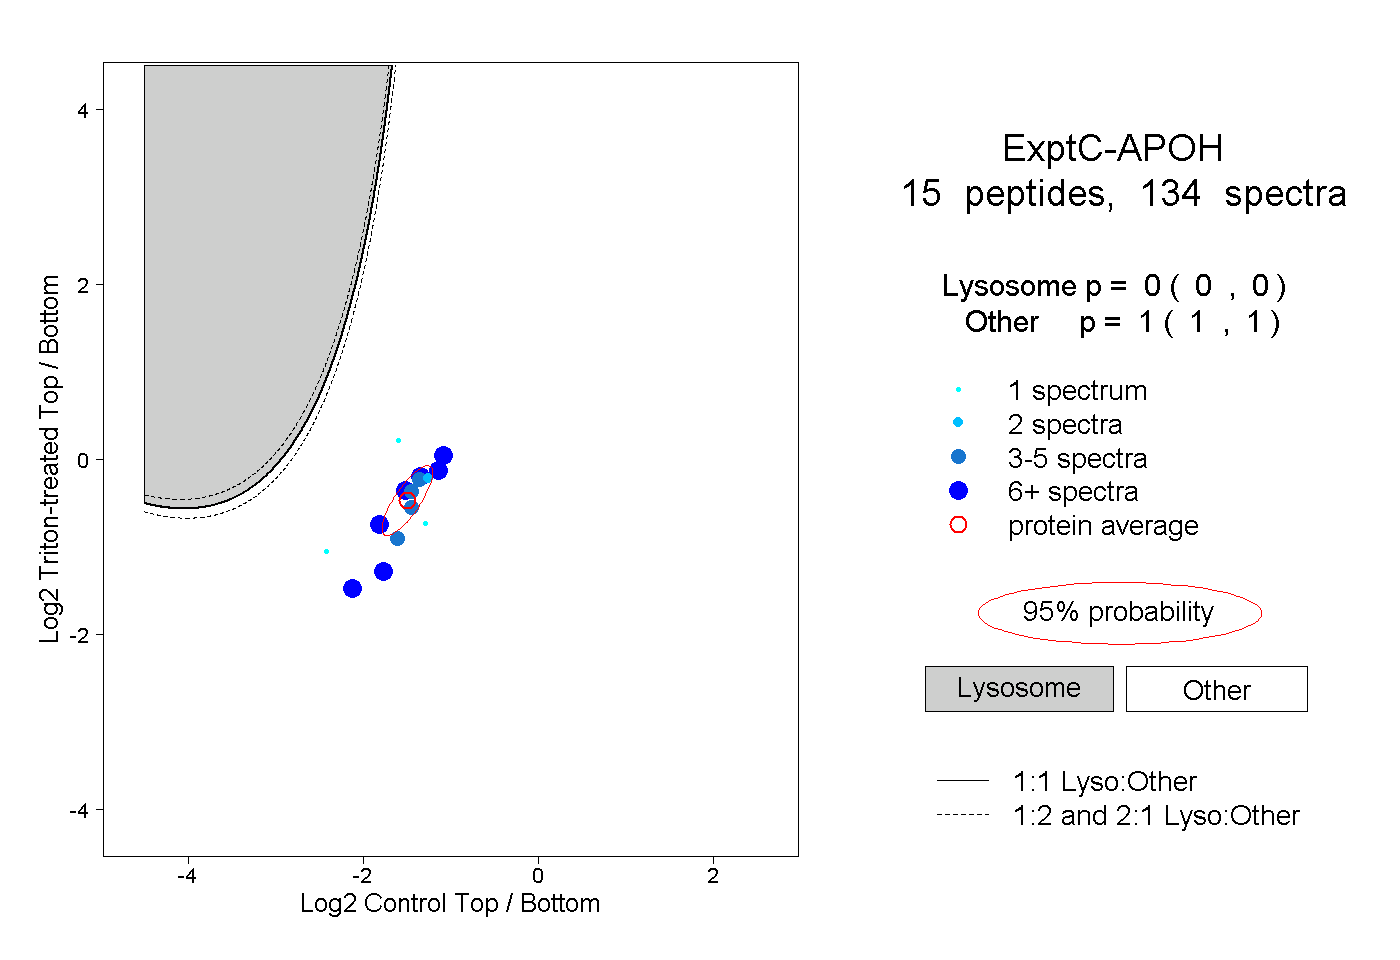 |
0.000 0.000 | 0.000 |
1.000 1.000 | 1.000 |
||||||||
| Plot | Lyso | Other | |||||||||||
| Expt D |
3 peptides |
5 spectra |
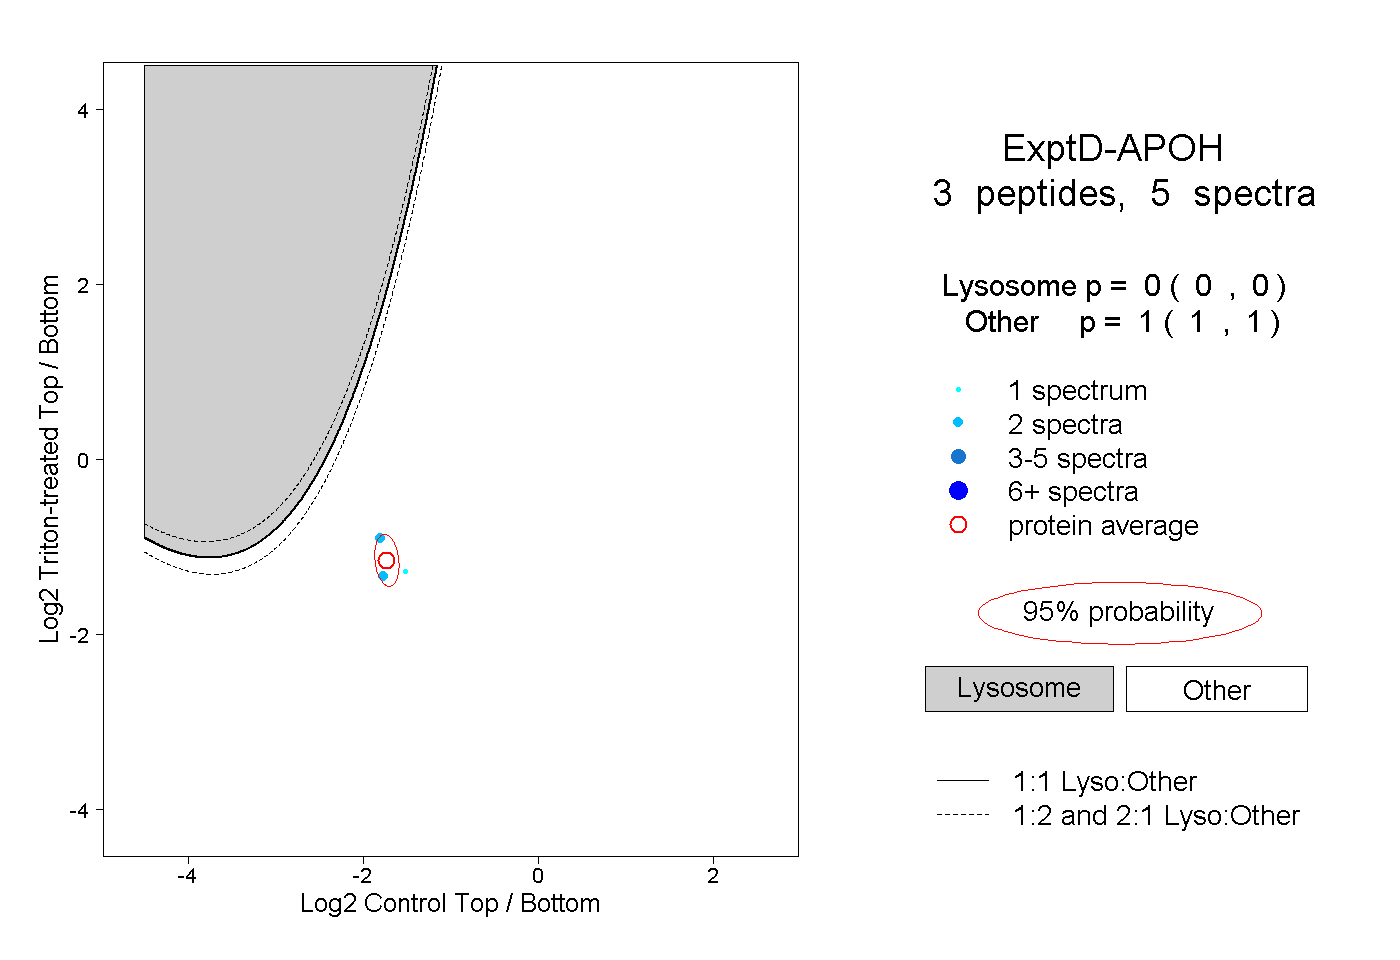 |
0.000 0.000 | 0.000 |
1.000 1.000 | 1.000 |