 4
4peptides
spectra
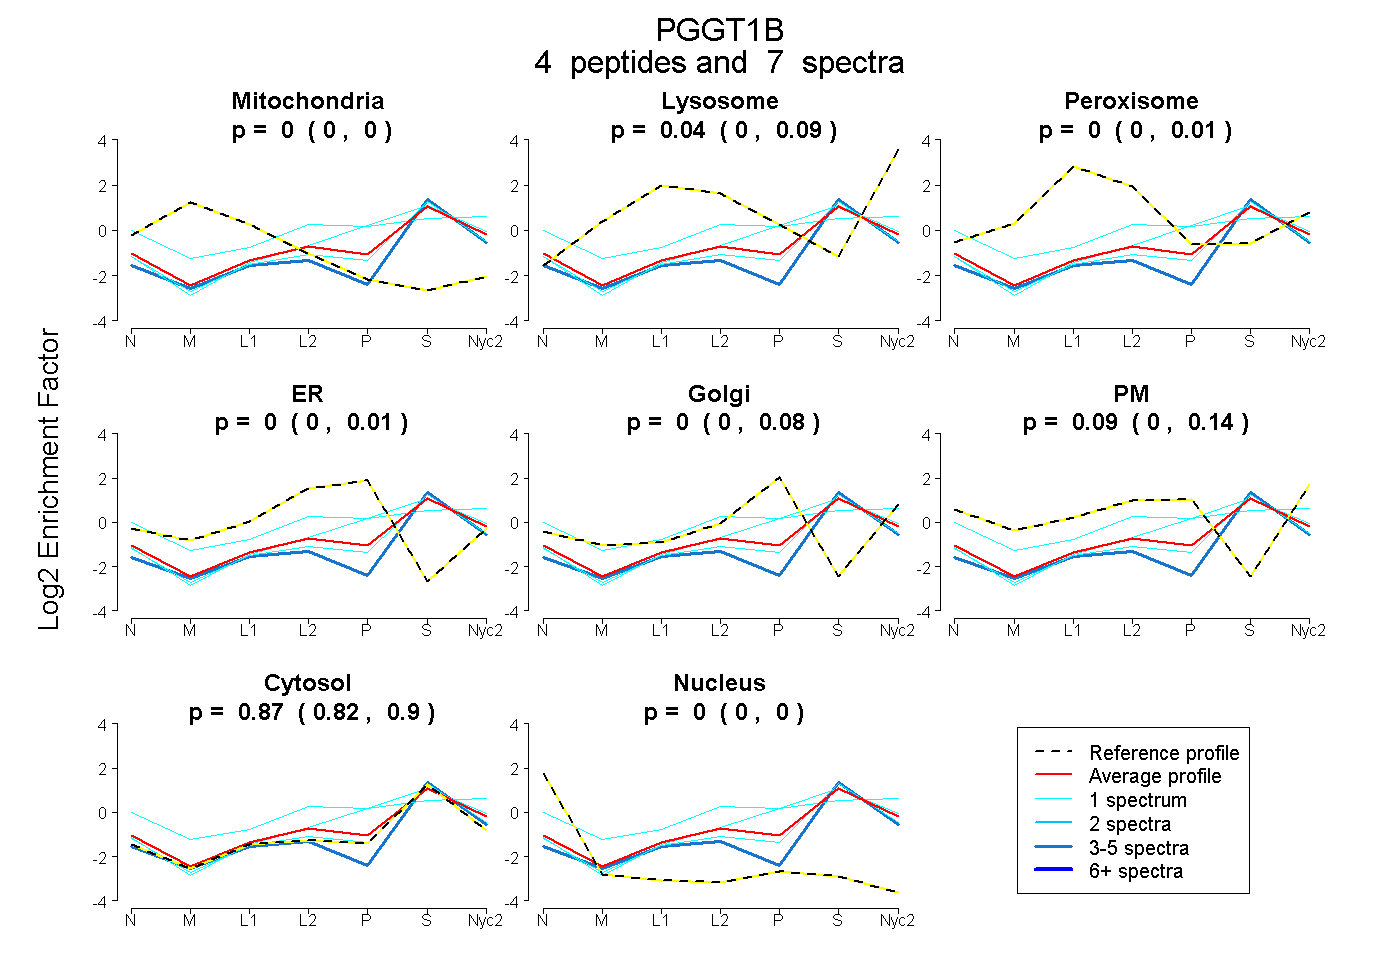
0.000 | 0.000
0.000 | 0.092
0.000 | 0.010
0.000 | 0.007
0.000 | 0.083
0.000 | 0.141
0.816 | 0.899
0.000 | 0.000
1peptide
spectrum
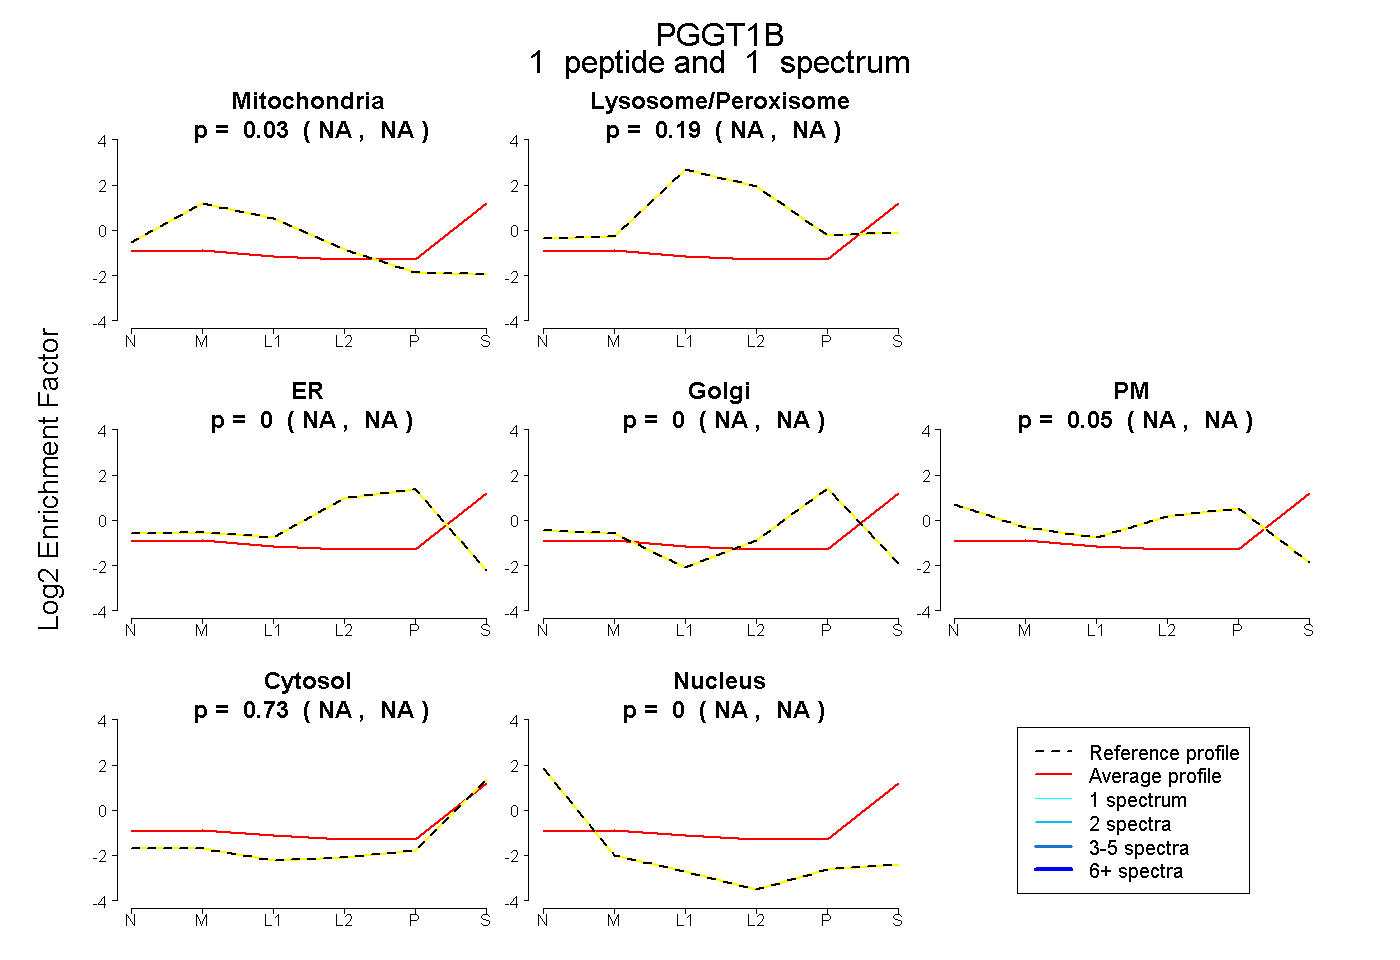
NA | NA
NA | NA
NA | NA
NA | NA
NA | NA
NA | NA
NA | NA
1peptide
spectrum
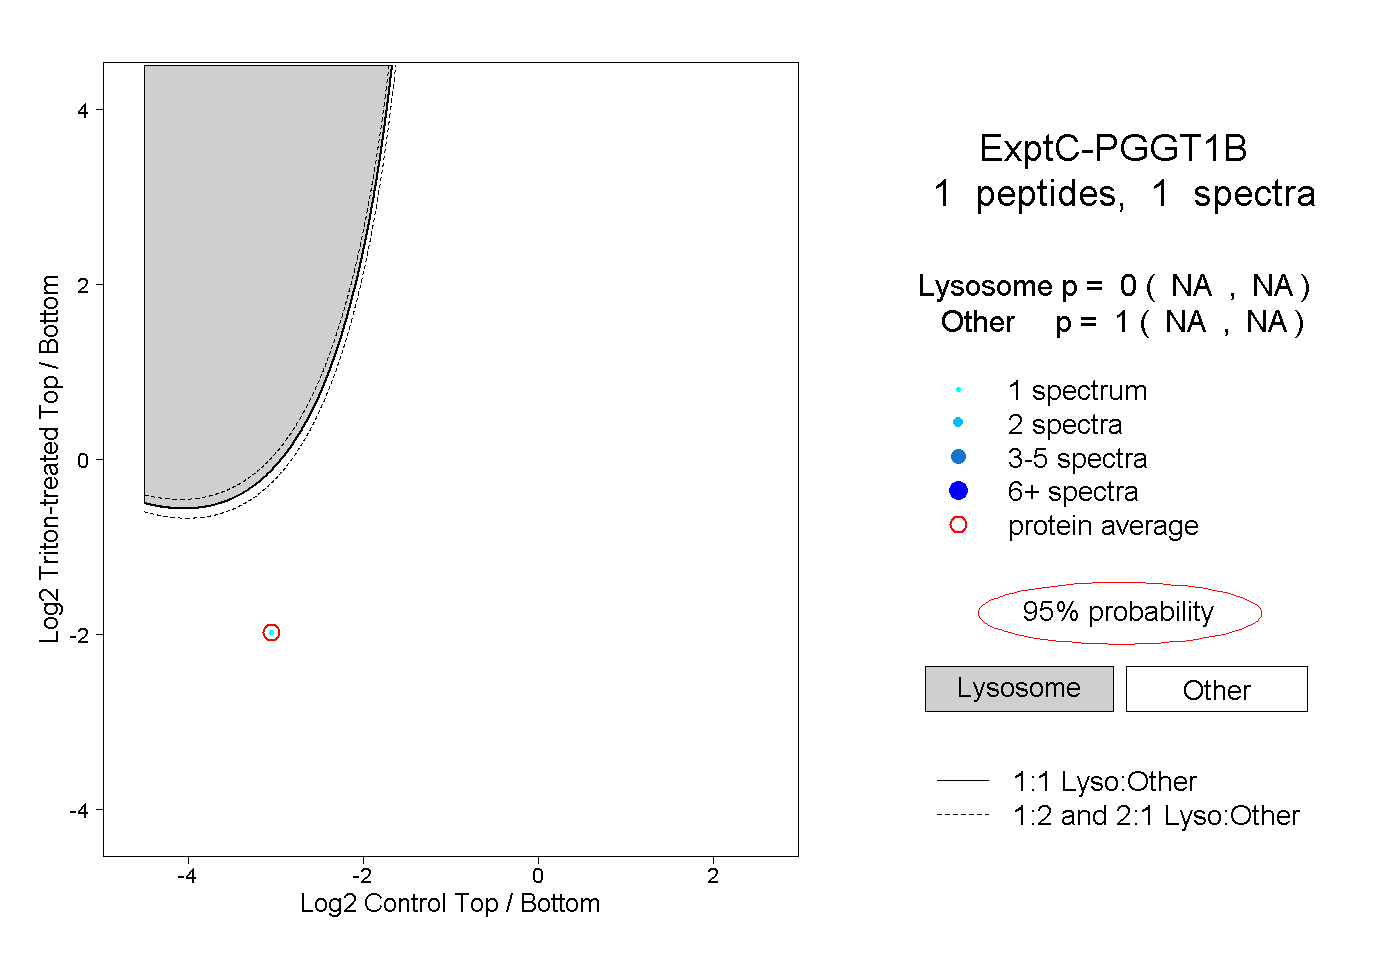
NA | NA
NA | NA