 12
12peptides
spectra
0.527 | 0.536
0.000 | 0.000
0.000 | 0.000
0.000 | 0.000
0.000 | 0.000
0.000 | 0.000
0.461 | 0.472
0.000 | 0.005
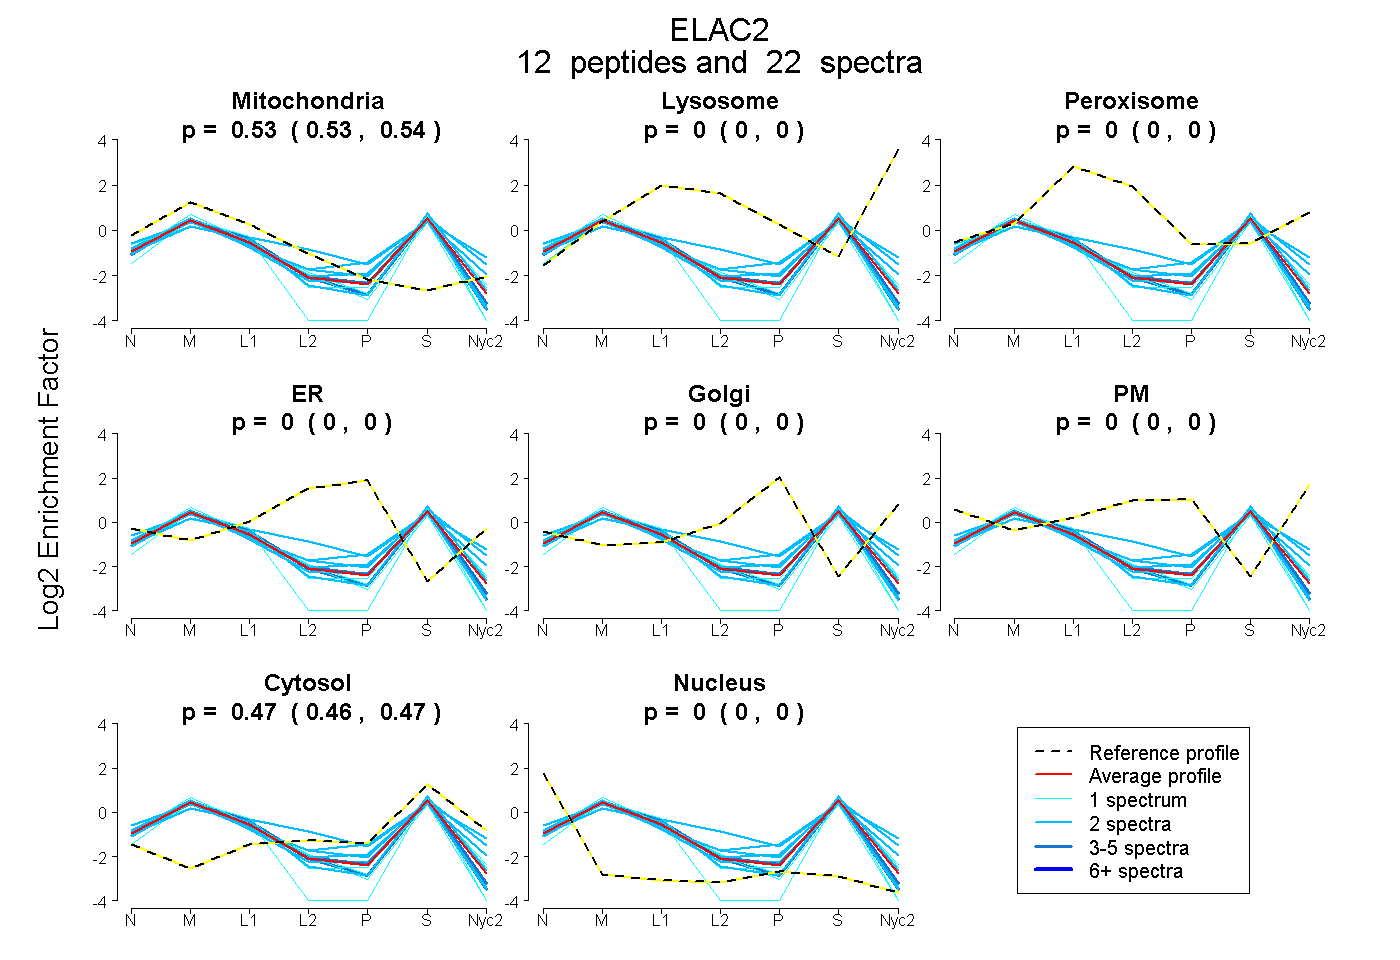
| Plot | Mito | Lyso | Perox | ER | Golgi | PM | Cytosol | Nucleus | |||||
| Expt A |
12 peptides |
22 spectra |
|
0.532 0.527 | 0.536 |
0.000 0.000 | 0.000 |
0.000 0.000 | 0.000 |
0.000 0.000 | 0.000 |
0.000 0.000 | 0.000 |
0.000 0.000 | 0.000 |
0.468 0.461 | 0.472 |
0.000 0.000 | 0.005 |
| 2 spectra, YQLRPK | 0.529 | 0.000 | 0.000 | 0.000 | 0.000 | 0.000 | 0.423 | 0.048 | ||
| 3 spectra, ALFADDIEEMVER | 0.535 | 0.000 | 0.000 | 0.000 | 0.000 | 0.000 | 0.439 | 0.026 | ||
| 3 spectra, IPLFSPDFNEK | 0.554 | 0.000 | 0.000 | 0.000 | 0.000 | 0.000 | 0.428 | 0.018 | ||
| 2 spectra, RPRPPK | 0.460 | 0.000 | 0.000 | 0.000 | 0.000 | 0.000 | 0.540 | 0.000 | ||
| 2 spectra, YLFNCGEGVQR | 0.544 | 0.000 | 0.000 | 0.000 | 0.000 | 0.000 | 0.449 | 0.007 | ||
| 2 spectra, THSTTSQAIGVGMR | 0.482 | 0.000 | 0.000 | 0.000 | 0.000 | 0.000 | 0.505 | 0.013 | ||
| 1 spectrum, ELGLPVGTAAIAPIIAAVK | 0.420 | 0.000 | 0.000 | 0.000 | 0.000 | 0.000 | 0.318 | 0.262 | ||
| 2 spectra, EEGSTFSLPTVR | 0.516 | 0.000 | 0.000 | 0.000 | 0.000 | 0.000 | 0.484 | 0.000 | ||
| 1 spectrum, DAGAALYVFSEYNR | 0.532 | 0.000 | 0.000 | 0.000 | 0.000 | 0.000 | 0.468 | 0.000 | ||
| 2 spectra, GAEVPSPPVER | 0.400 | 0.000 | 0.142 | 0.000 | 0.000 | 0.000 | 0.458 | 0.000 | ||
| 1 spectrum, SVLLDCGEGTFGQLCR | 0.595 | 0.000 | 0.000 | 0.000 | 0.000 | 0.000 | 0.331 | 0.074 | ||
| 1 spectrum, SQYPEIVFLGTGSAIPMK | 0.512 | 0.000 | 0.000 | 0.000 | 0.000 | 0.000 | 0.488 | 0.000 |
| Plot | Lyso | Other | |||||||||||
| Expt C |
17 peptides |
53 spectra |
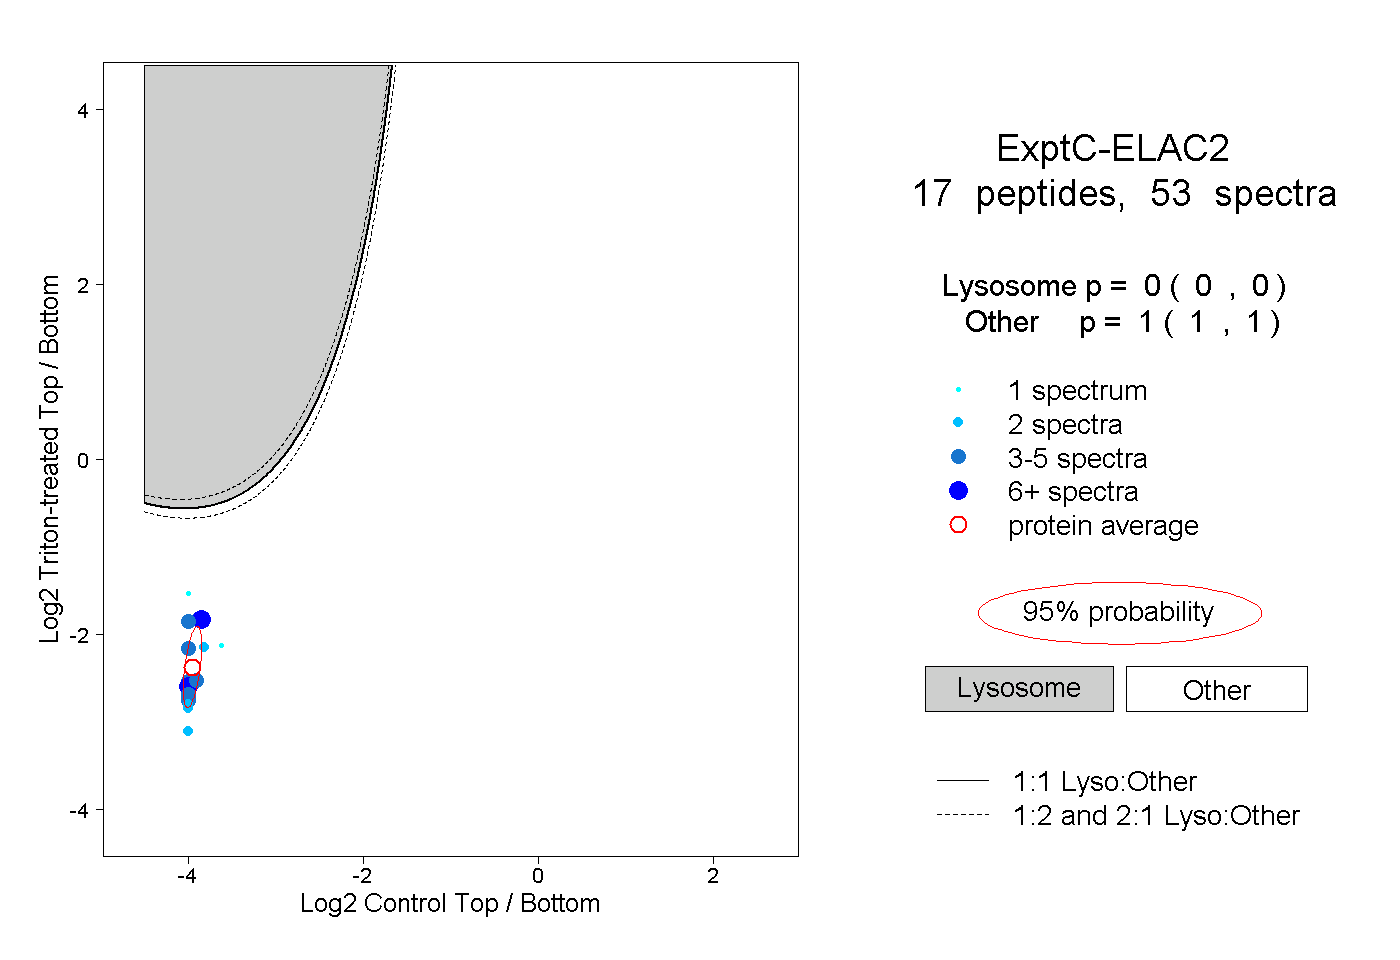 |
0.000 0.000 | 0.000 |
1.000 1.000 | 1.000 |
||||||||
| Plot | Lyso | Other | |||||||||||
| Expt D |
4 peptides |
7 spectra |
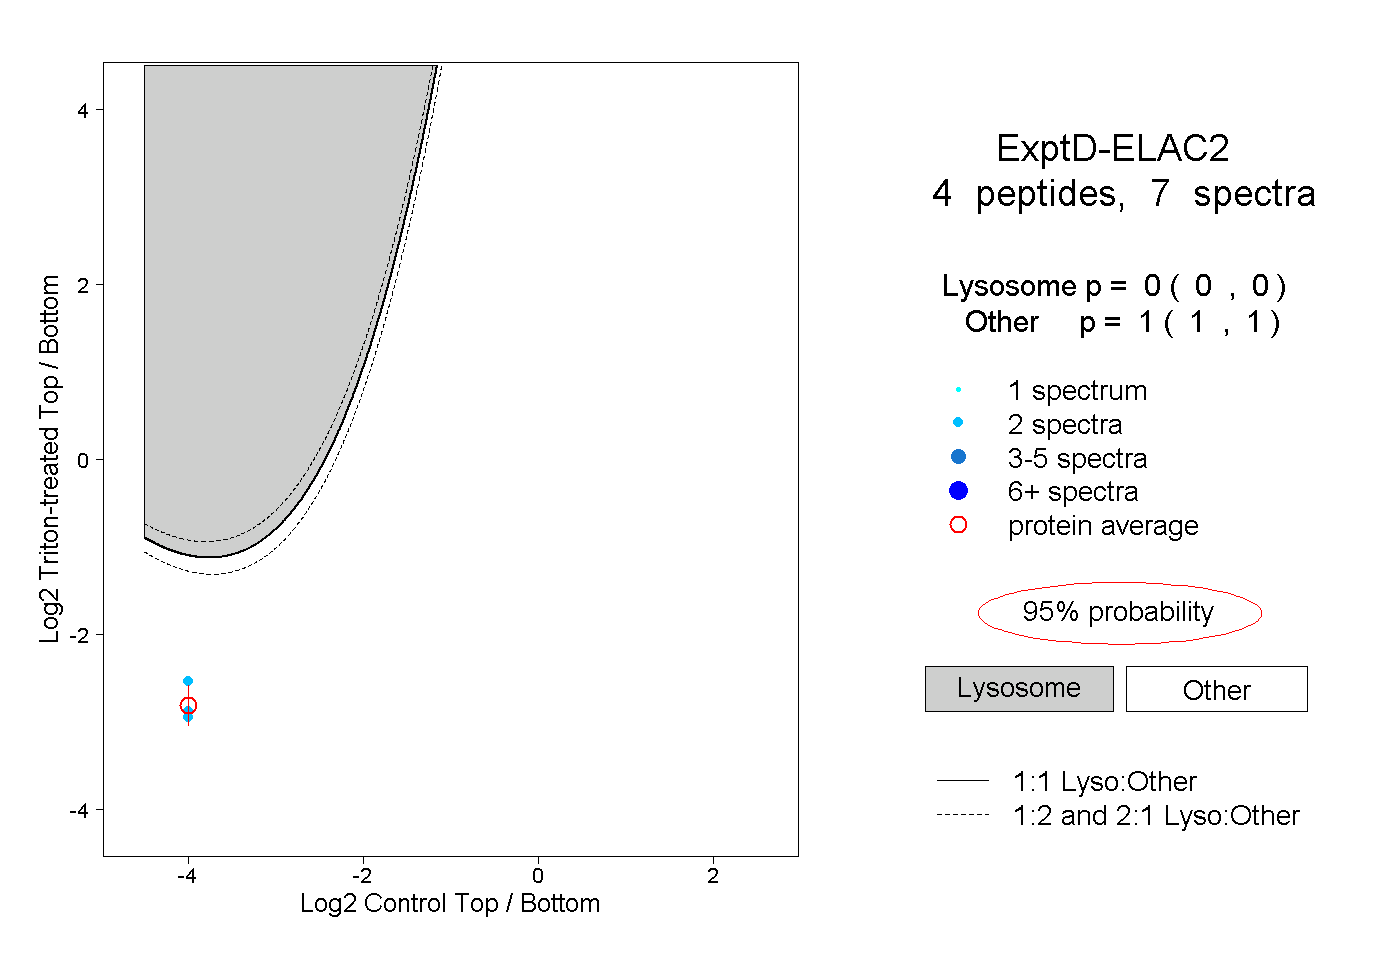 |
0.000 0.000 | 0.000 |
1.000 1.000 | 1.000 |