 4
4peptides
spectra
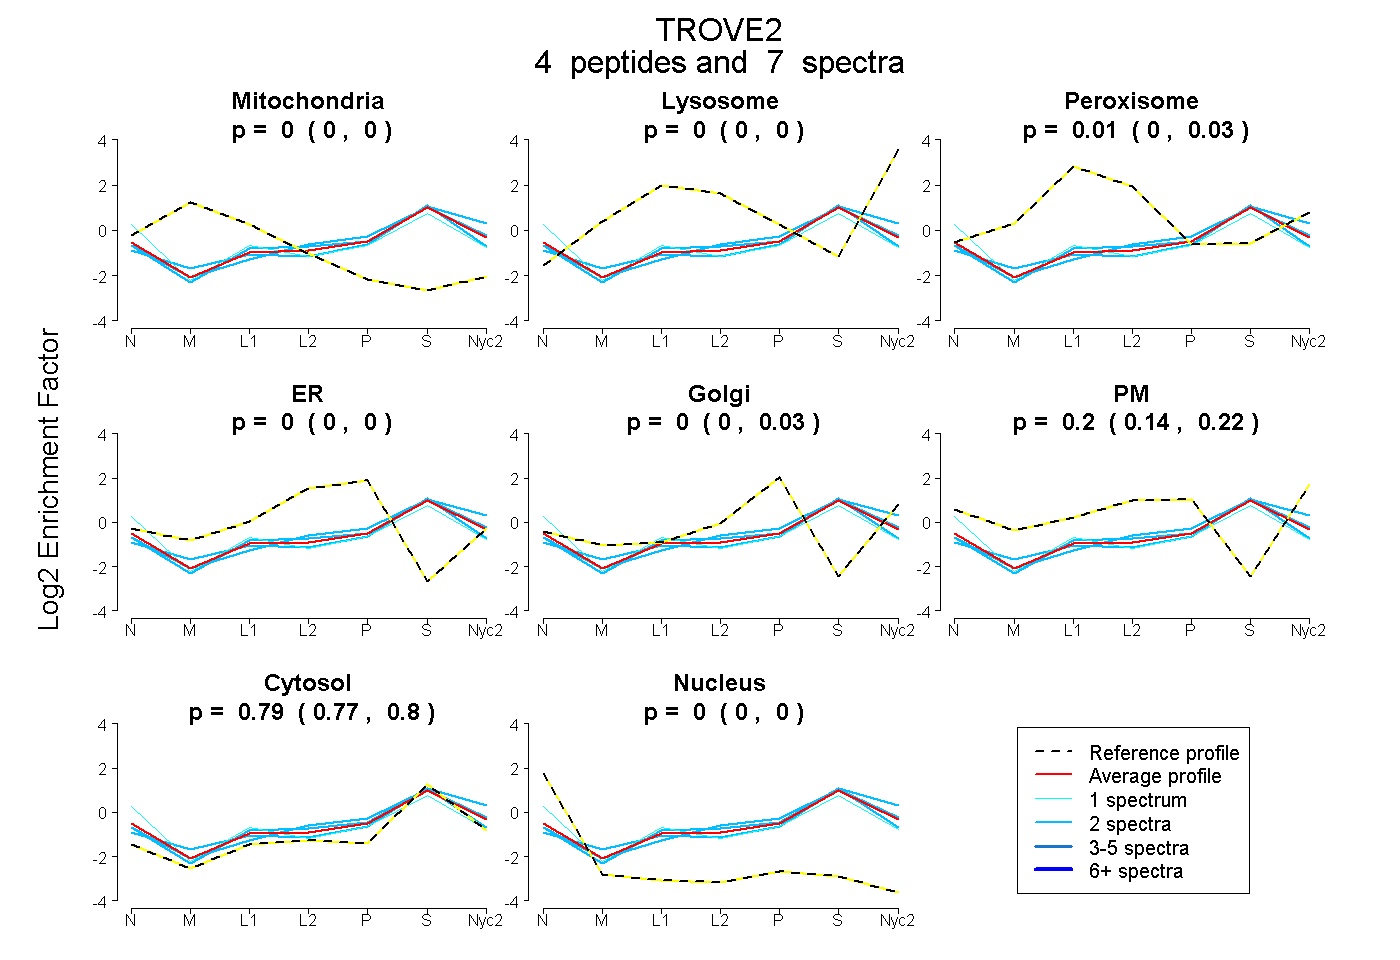
0.000 | 0.000
0.000 | 0.000
0.000 | 0.031
0.000 | 0.001
0.000 | 0.027
0.137 | 0.221
0.772 | 0.802
0.000 | 0.000
| Plot | Mito | Lyso | Perox | ER | Golgi | PM | Cytosol | Nucleus | |||||
| Expt A |
4 peptides |
7 spectra |
|
0.000 0.000 | 0.000 |
0.000 0.000 | 0.000 |
0.006 0.000 | 0.031 |
0.000 0.000 | 0.001 |
0.000 0.000 | 0.027 |
0.205 0.137 | 0.221 |
0.789 0.772 | 0.802 |
0.000 0.000 | 0.000 |
| 1 spectrum, YLEAVEK | 0.000 | 0.000 | 0.089 | 0.000 | 0.000 | 0.137 | 0.656 | 0.118 | ||
| 2 spectra, EVHEQYK | 0.000 | 0.000 | 0.000 | 0.000 | 0.066 | 0.164 | 0.770 | 0.000 | ||
| 2 spectra, AVADWYNEK | 0.000 | 0.084 | 0.000 | 0.000 | 0.000 | 0.153 | 0.763 | 0.000 | ||
| 2 spectra, LGLENAEALIR | 0.028 | 0.000 | 0.067 | 0.000 | 0.107 | 0.000 | 0.798 | 0.000 |
| Plot | Lyso | Other | |||||||||||
| Expt C |
1 peptide |
2 spectra |
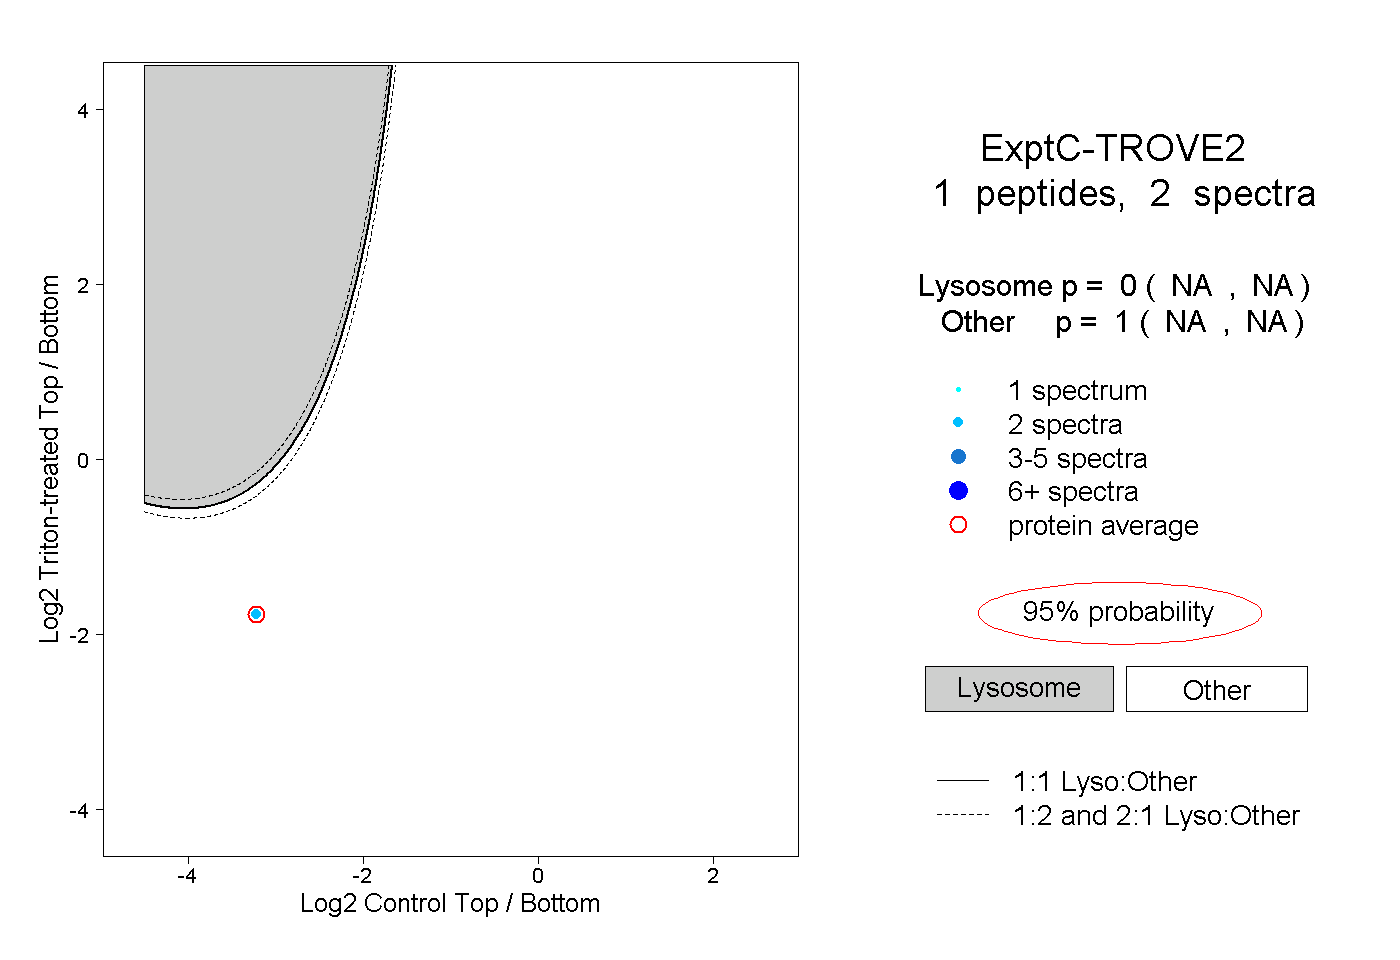 |
0.000 NA | NA |
1.000 NA | NA |