 3
3peptides
spectra
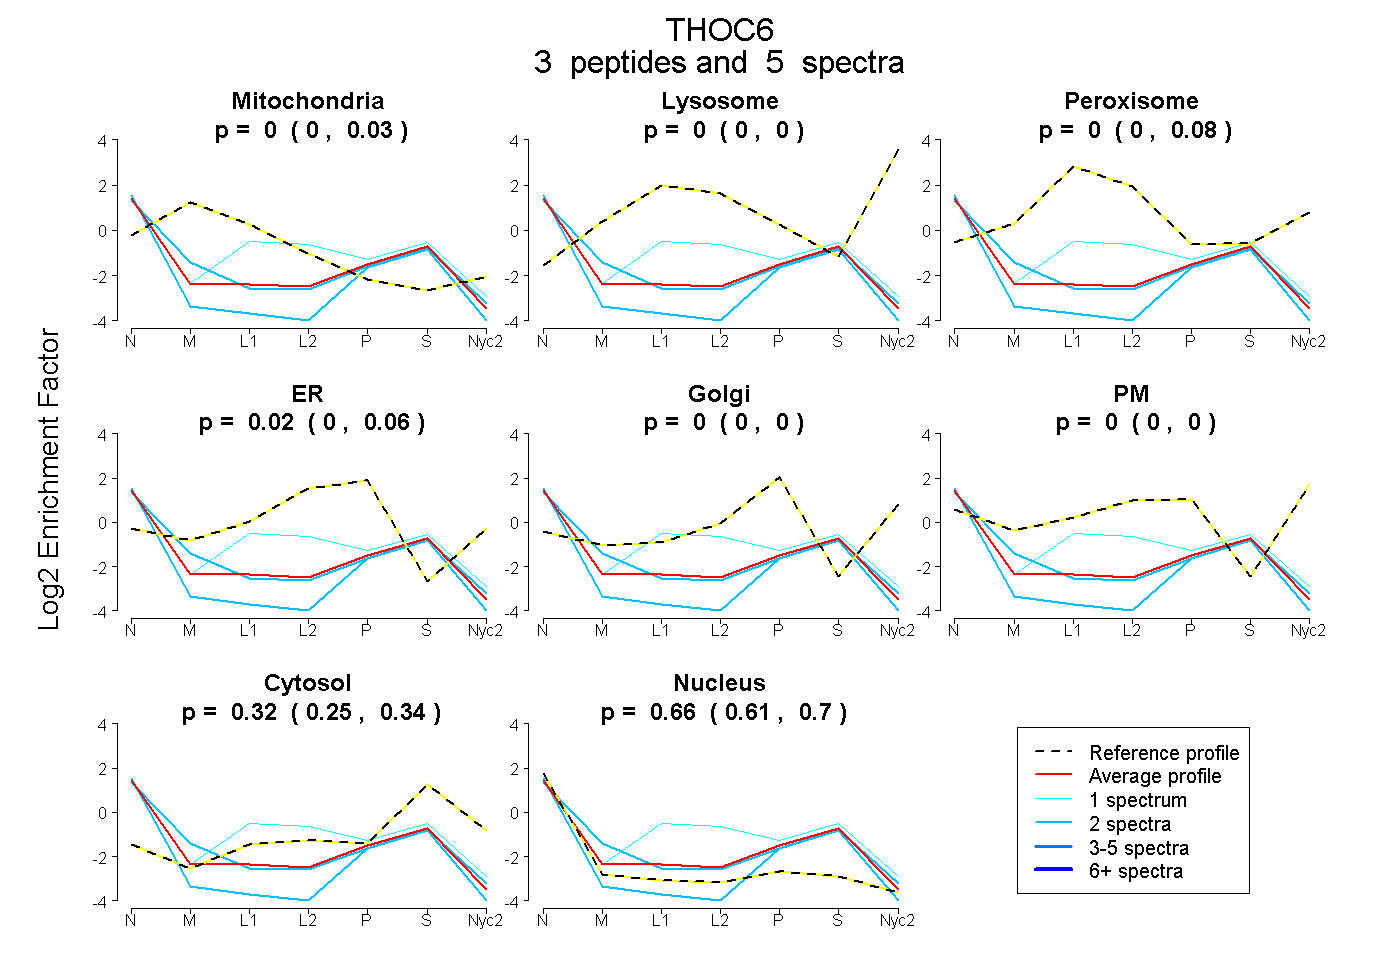
0.000 | 0.034
0.000 | 0.000
0.000 | 0.085
0.000 | 0.055
0.000 | 0.000
0.000 | 0.000
0.247 | 0.336
0.613 | 0.703
1peptide
spectra
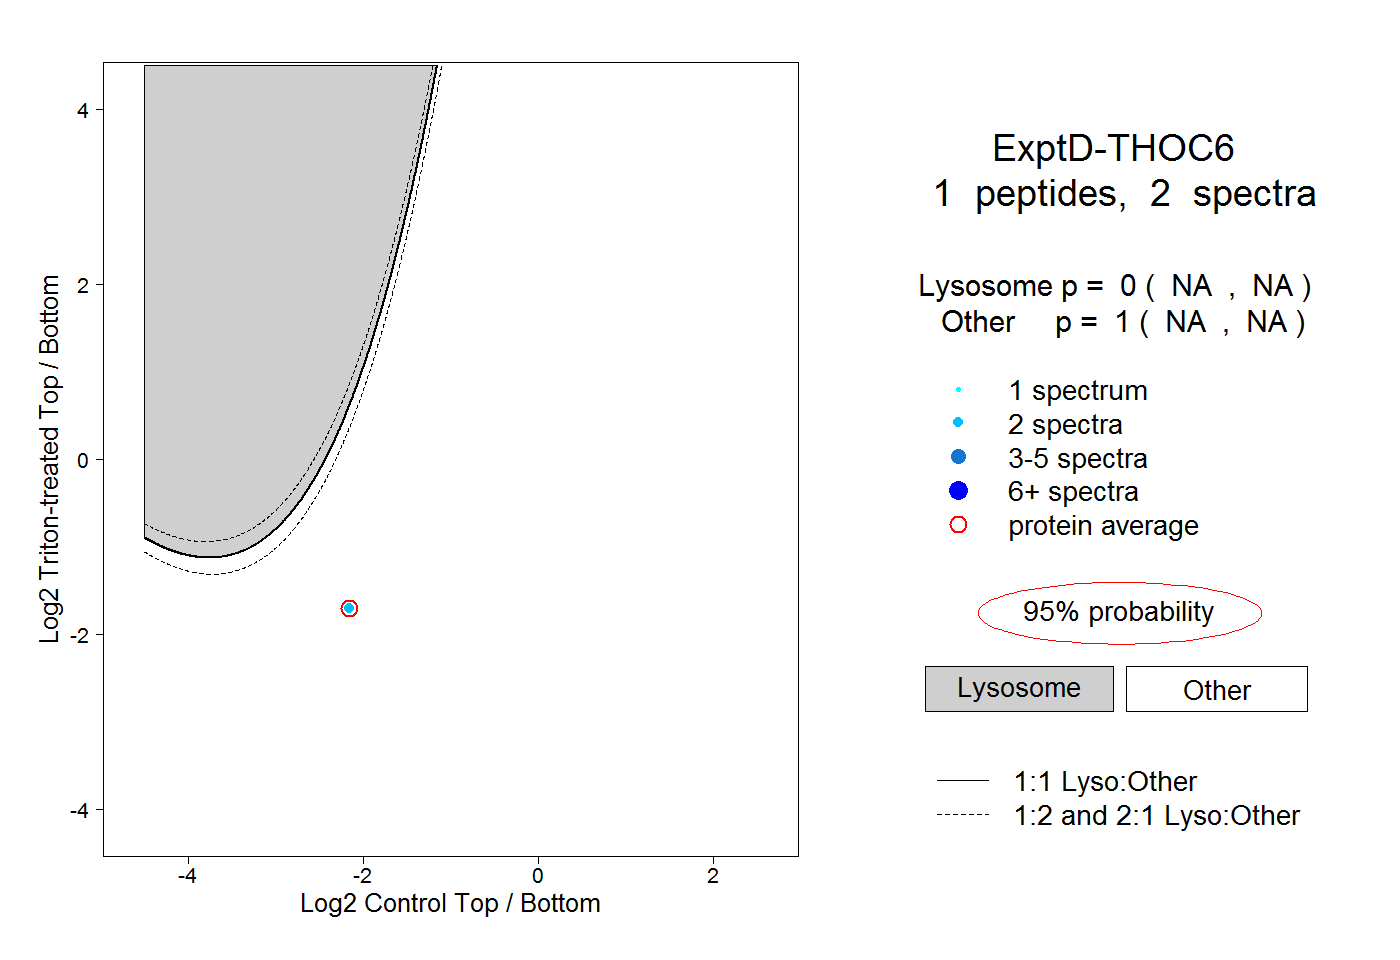
NA | NA
NA | NA
| Plot | Mito | Lyso | Perox | ER | Golgi | PM | Cytosol | Nucleus | |||||
| Expt A |
3 peptides |
5 spectra |
|
0.000 0.000 | 0.034 |
0.000 0.000 | 0.000 |
0.000 0.000 | 0.085 |
0.017 0.000 | 0.055 |
0.000 0.000 | 0.000 |
0.000 0.000 | 0.000 |
0.323 0.247 | 0.336 |
0.660 0.613 | 0.703 |
||
| Plot | Lyso | Other | |||||||||||
| Expt D |
1 peptide |
2 spectra |
|
0.000 NA | NA |
1.000 NA | NA |