 1
1peptide
spectra
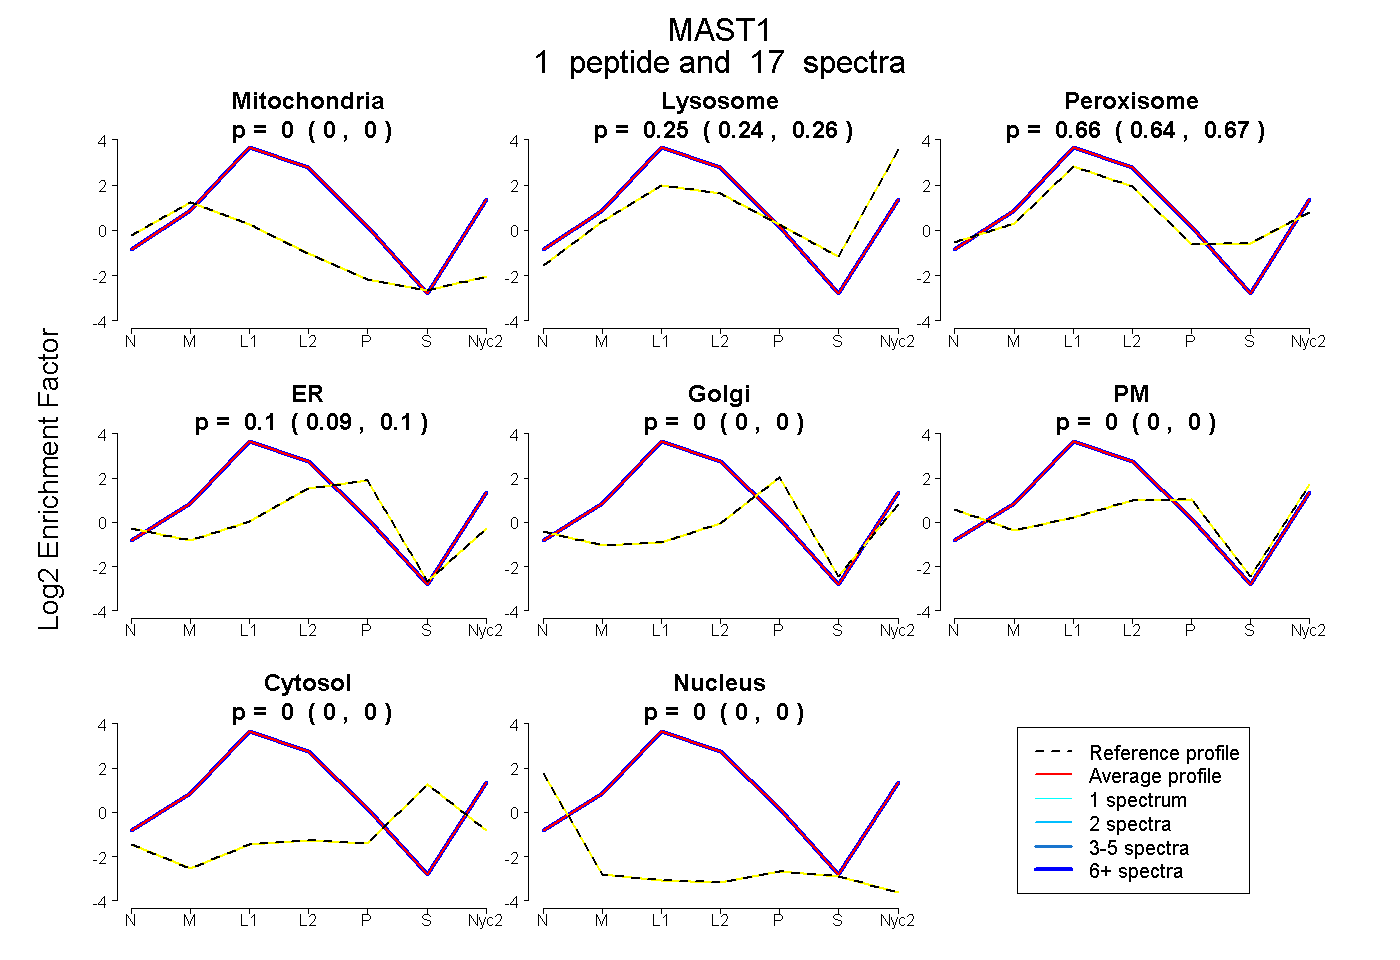
0.000 | 0.000
0.241 | 0.256
0.642 | 0.665
0.088 | 0.103
0.000 | 0.000
0.000 | 0.000
0.000 | 0.000
0.000 | 0.000
1peptide
spectrum
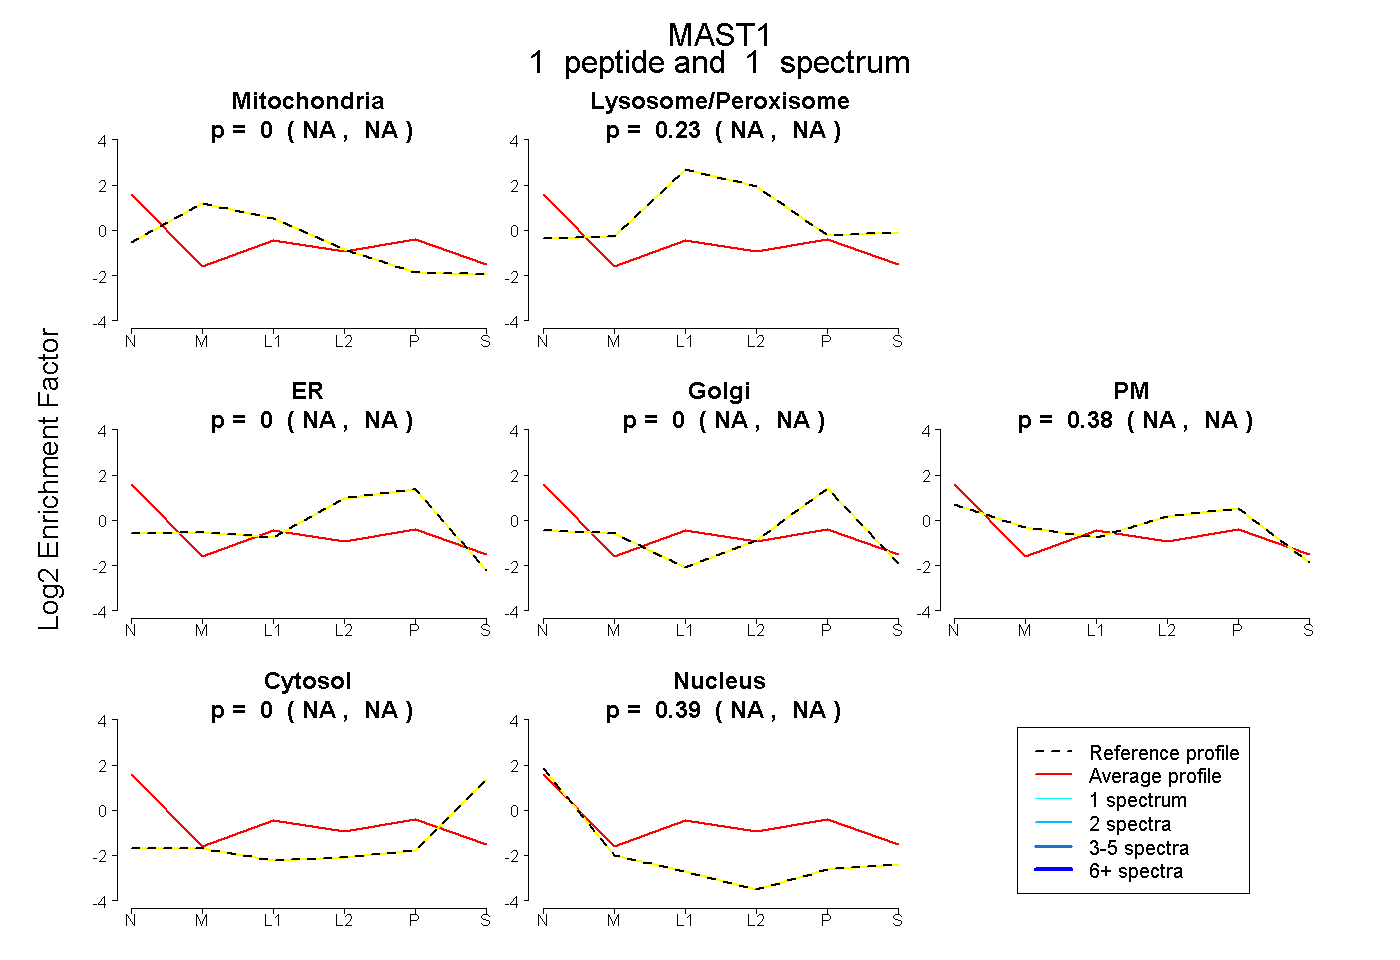
NA | NA
NA | NA
NA | NA
NA | NA
NA | NA
NA | NA
NA | NA
1peptide
spectra
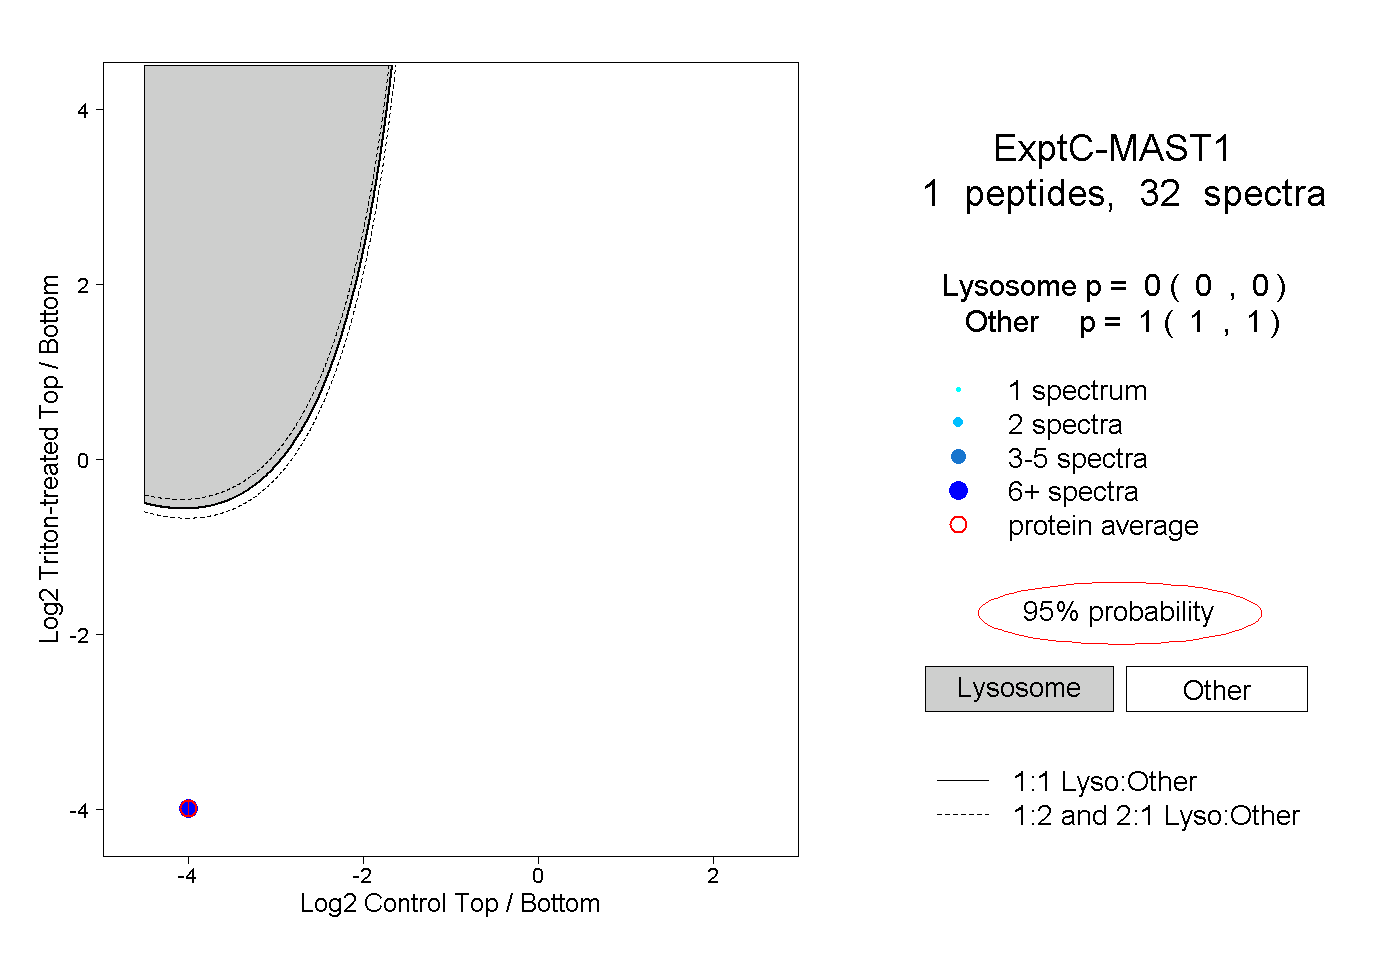
0.000 | 0.000
1.000 | 1.000