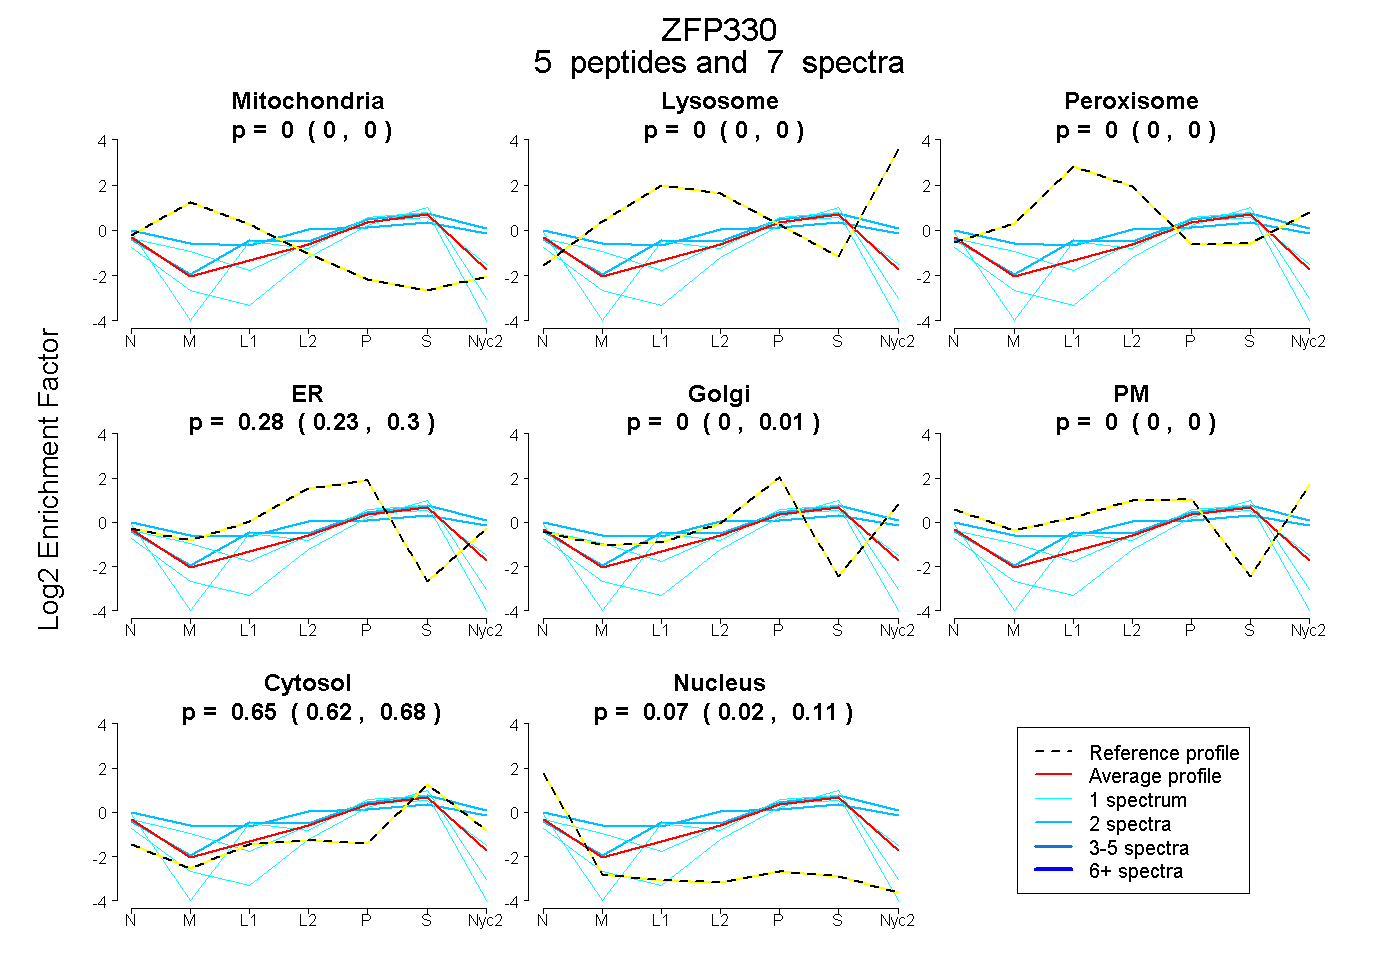
 5
5peptides
spectra
0.000 | 0.000
0.000 | 0.000
0.000 | 0.000
0.228 | 0.303
0.000 | 0.006
0.000 | 0.000
0.619 | 0.682
0.021 | 0.110
| Plot | Mito | Lyso | Perox | ER | Golgi | PM | Cytosol | Nucleus | |||||
| Expt A |
5 peptides |
7 spectra |
|
0.000 0.000 | 0.000 |
0.000 0.000 | 0.000 |
0.000 0.000 | 0.000 |
0.275 0.228 | 0.303 |
0.000 0.000 | 0.006 |
0.000 0.000 | 0.000 |
0.655 0.619 | 0.682 |
0.070 0.021 | 0.110 |
| 1 spectrum, HPCNASMECDK | 0.019 | 0.000 | 0.000 | 0.290 | 0.029 | 0.000 | 0.603 | 0.058 | ||
| 1 spectrum, QTGGEEGDGASGYDAYWK | 0.000 | 0.000 | 0.000 | 0.172 | 0.000 | 0.000 | 0.605 | 0.223 | ||
| 2 spectra, DLSMSTR | 0.000 | 0.000 | 0.129 | 0.000 | 0.270 | 0.033 | 0.569 | 0.000 | ||
| 2 spectra, ACFCDEHTR | 0.025 | 0.000 | 0.108 | 0.073 | 0.000 | 0.301 | 0.492 | 0.000 | ||
| 1 spectrum, LPICAQCGK | 0.000 | 0.000 | 0.000 | 0.041 | 0.000 | 0.000 | 0.725 | 0.234 |
| Plot | Lyso | Other | |||||||||||
| Expt C |
1 peptide |
2 spectra |
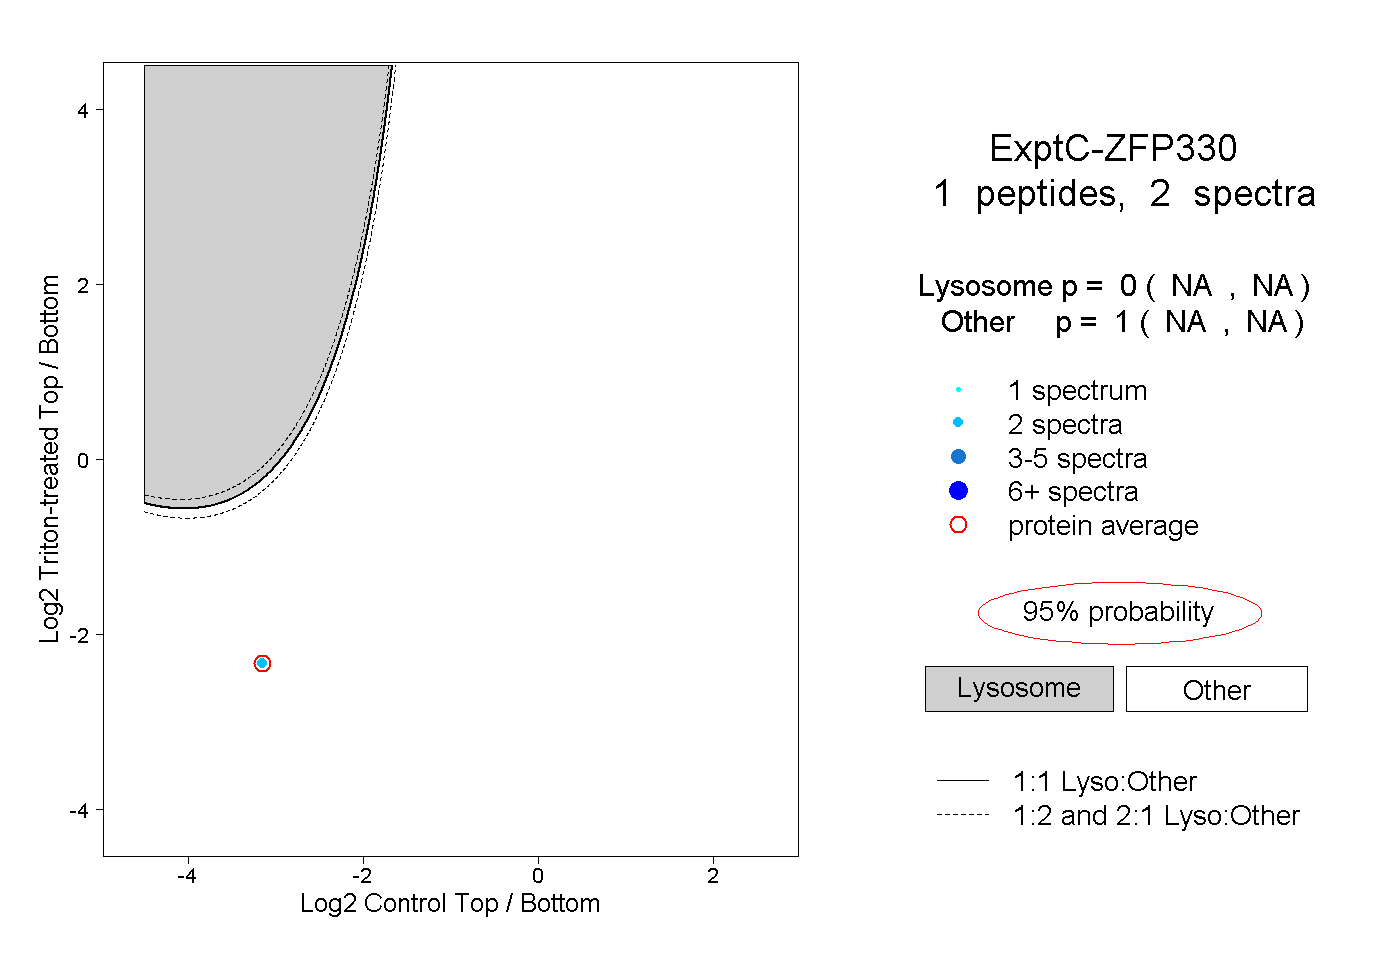 |
0.000 NA | NA |
1.000 NA | NA |
||||||||
| Plot | Lyso | Other | |||||||||||
| Expt D |
1 peptide |
1 spectrum |
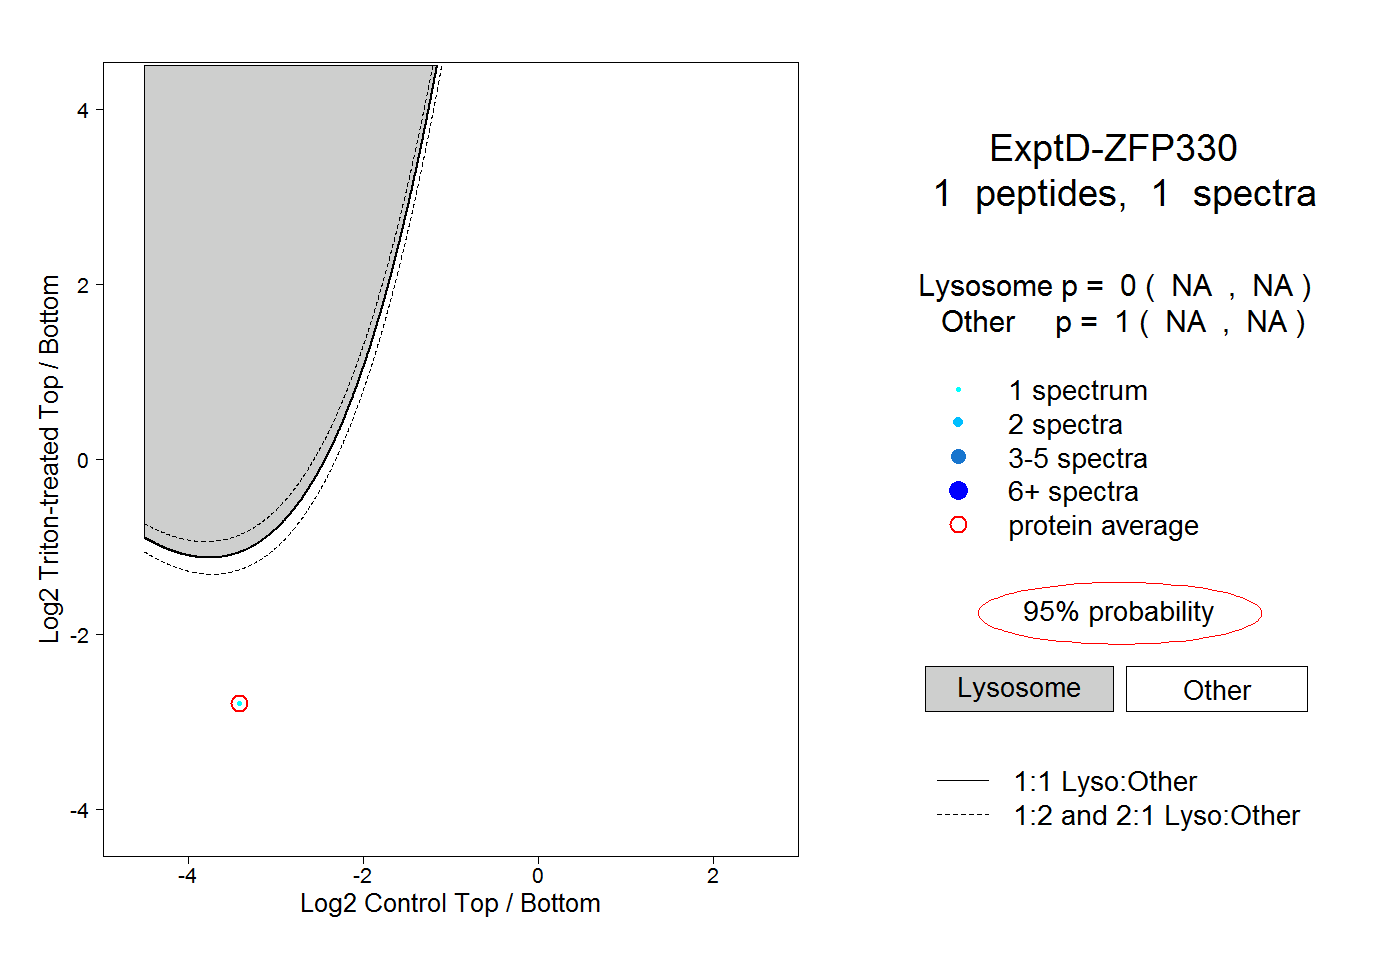 |
0.000 NA | NA |
1.000 NA | NA |