 36
36peptides
spectra
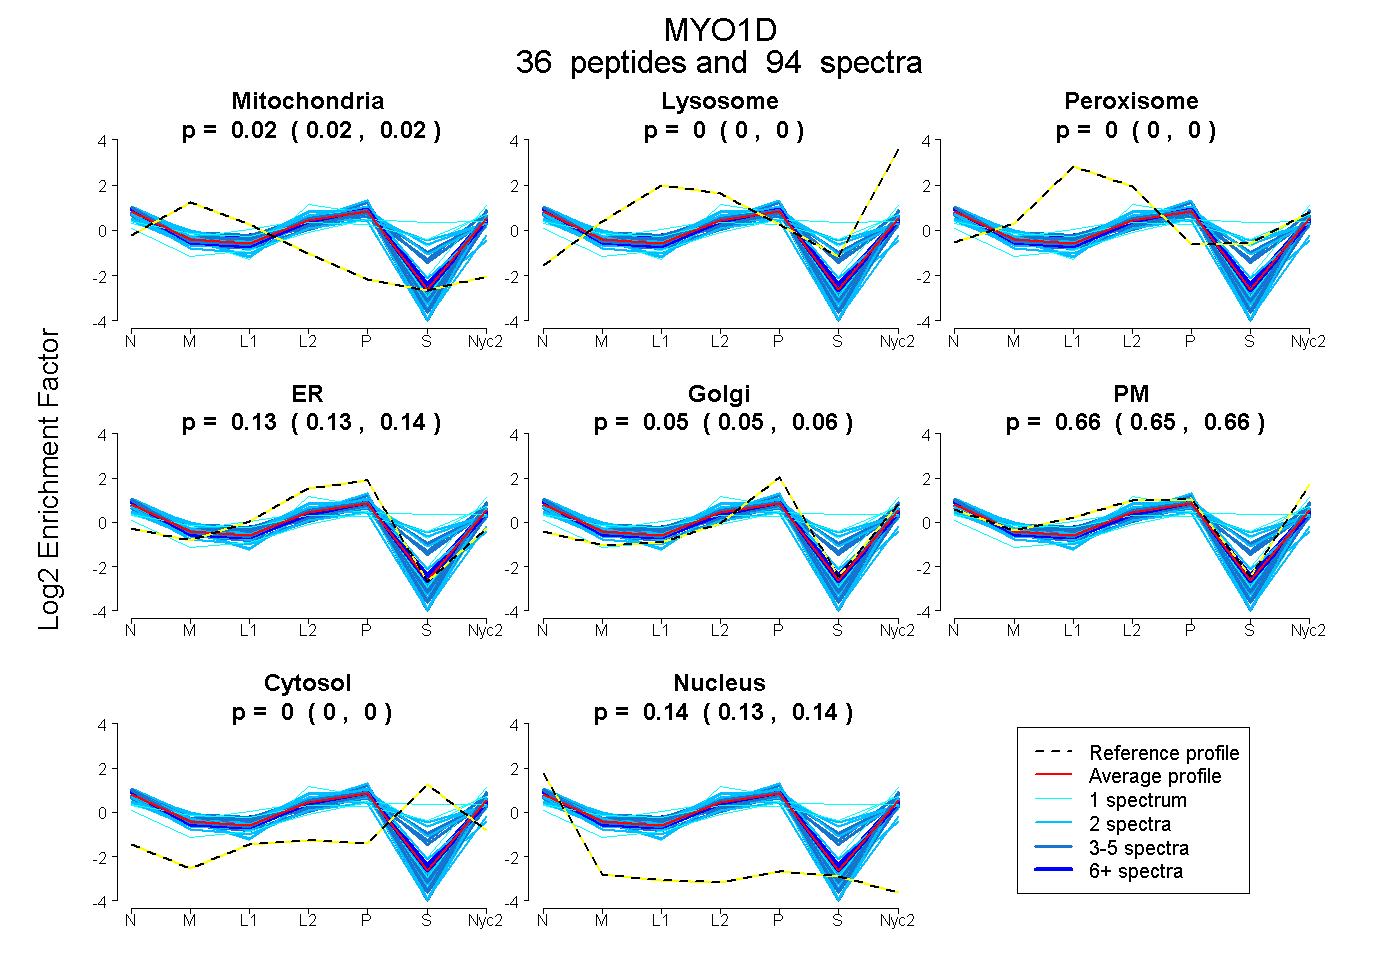
0.016 | 0.020
0.000 | 0.000
0.000 | 0.000
0.130 | 0.139
0.047 | 0.057
0.655 | 0.663
0.000 | 0.000
0.134 | 0.137
12peptides
spectra
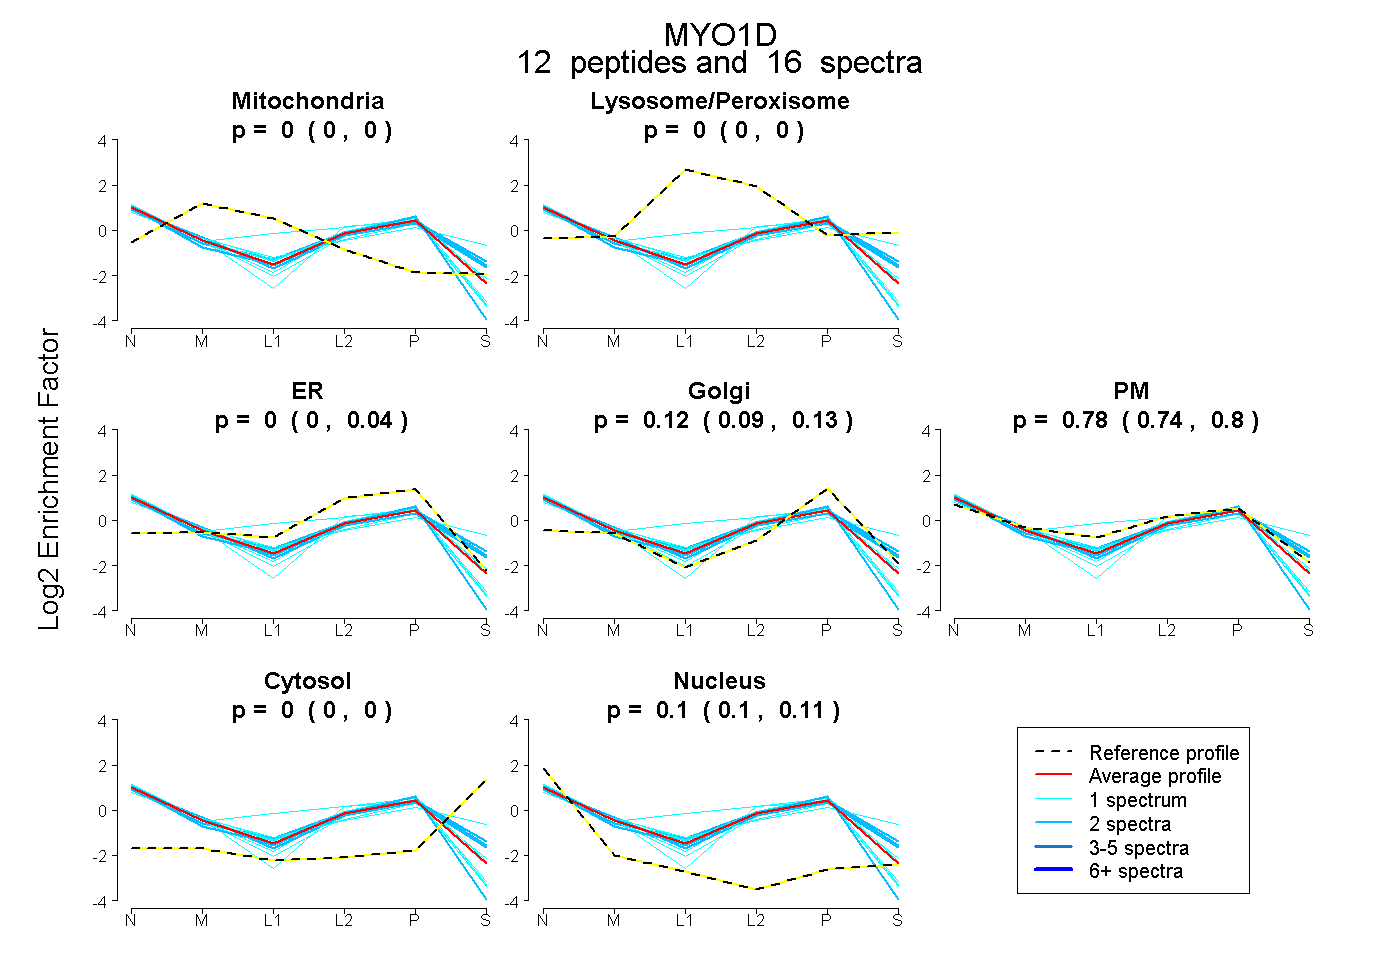
0.000 | 0.000
0.000 | 0.000
0.000 | 0.038
0.089 | 0.133
0.737 | 0.798
0.000 | 0.000
0.098 | 0.115
38peptides
spectra
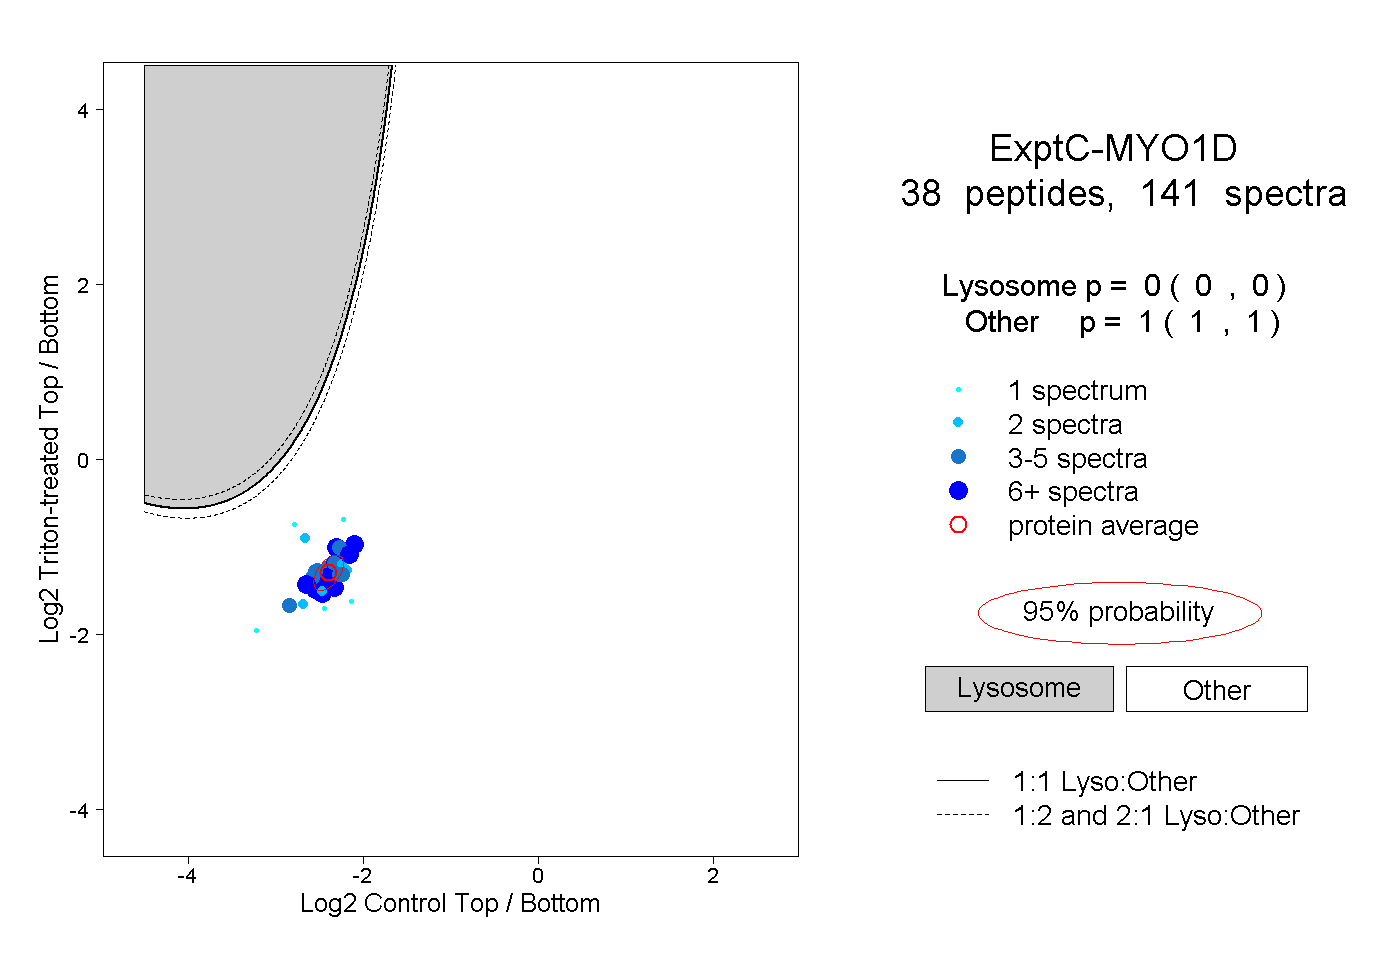
0.000 | 0.000
1.000 | 1.000
12peptides
spectra
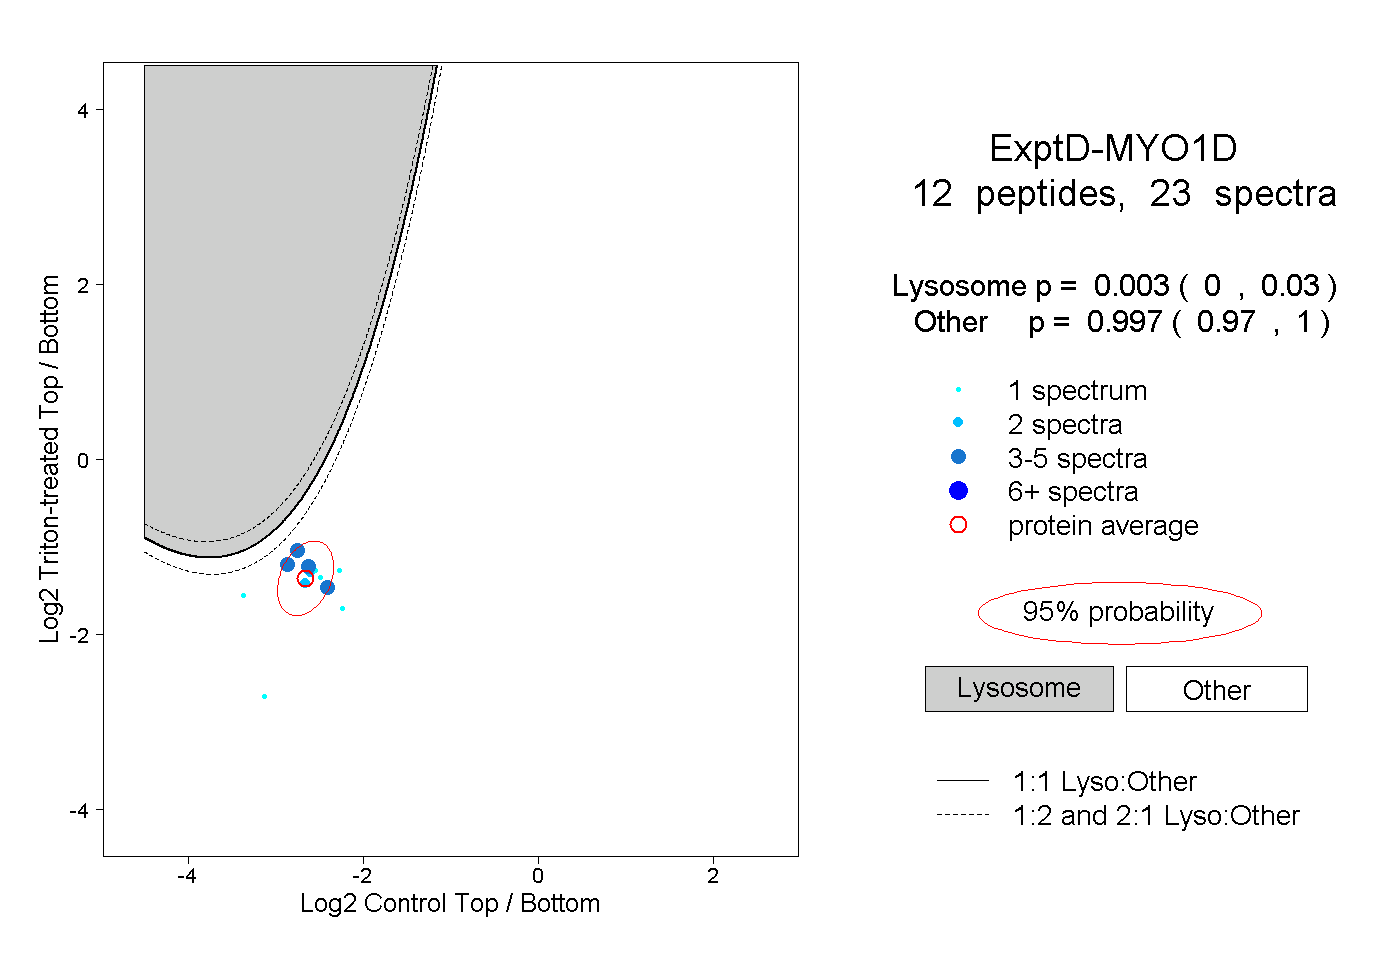
0.000 | 0.030
0.970 | 1.000