FDXR
[ENSRNOP00000004592]
Main page
| | | Plot |
Mito |
Lyso |
|
Perox |
ER |
Golgi |
PM |
Cytosol |
Nucleus |
|
| Expt A |
 18
18
peptides |
68
spectra |
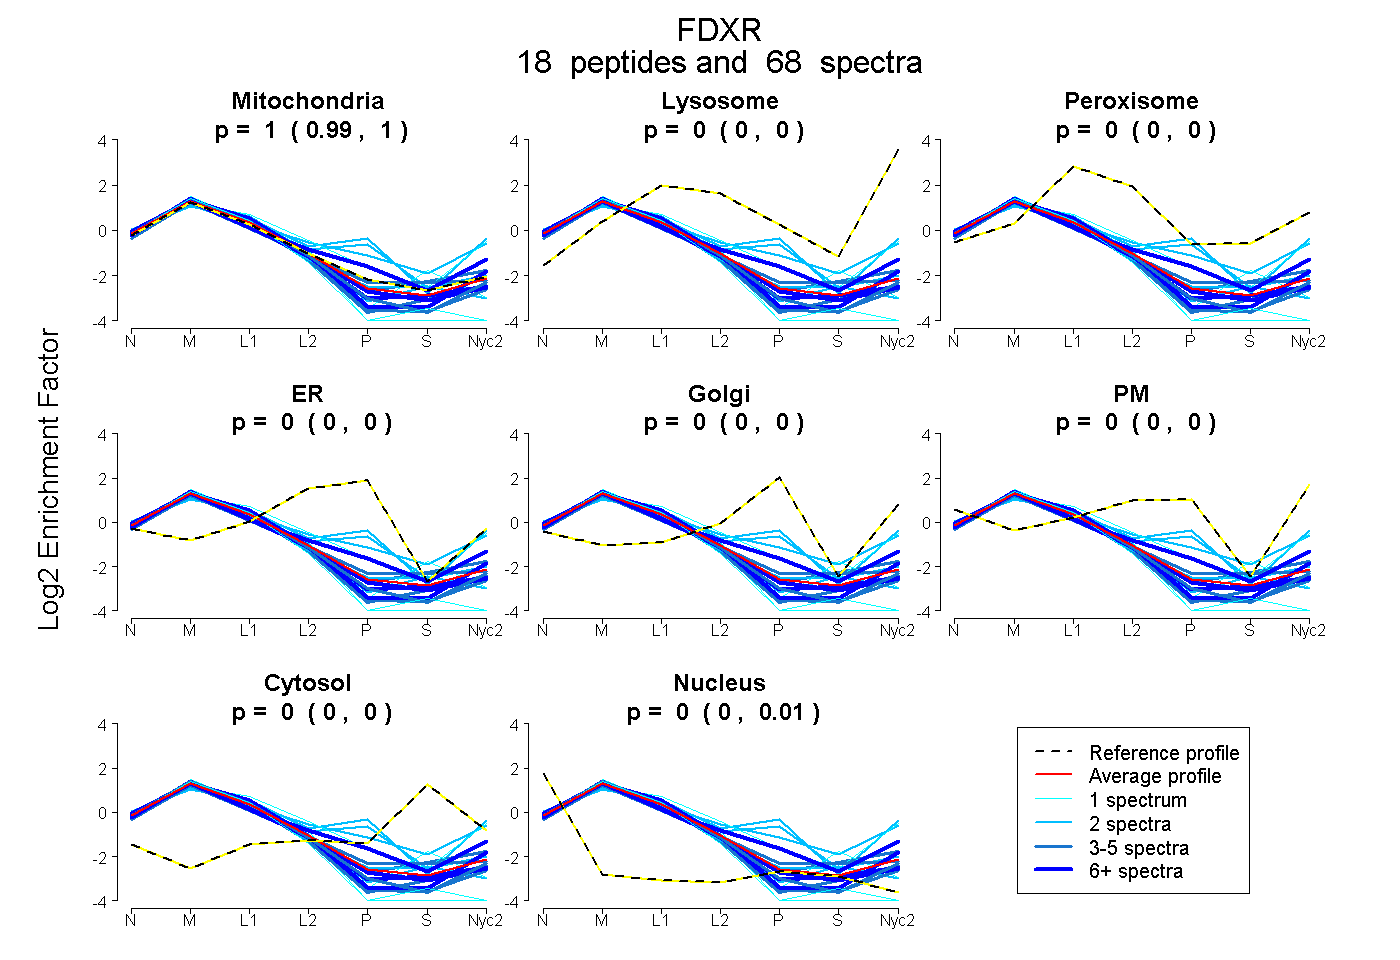 |
0.995
0.993 | 0.997 |
0.000
0.000 | 0.000 |
|
0.000
0.000 | 0.000 |
0.000
0.000 | 0.000 |
0.000
0.000 | 0.000 |
0.000
0.000 | 0.000 |
0.000
0.000 | 0.000 |
0.005
0.002 | 0.007 |
|
| | | Plot |
Mito |
|
Lyso or Perox |
|
ER |
Golgi |
PM |
Cytosol |
Nucleus |
|
| Expt B |
15
peptides |
57
spectra |
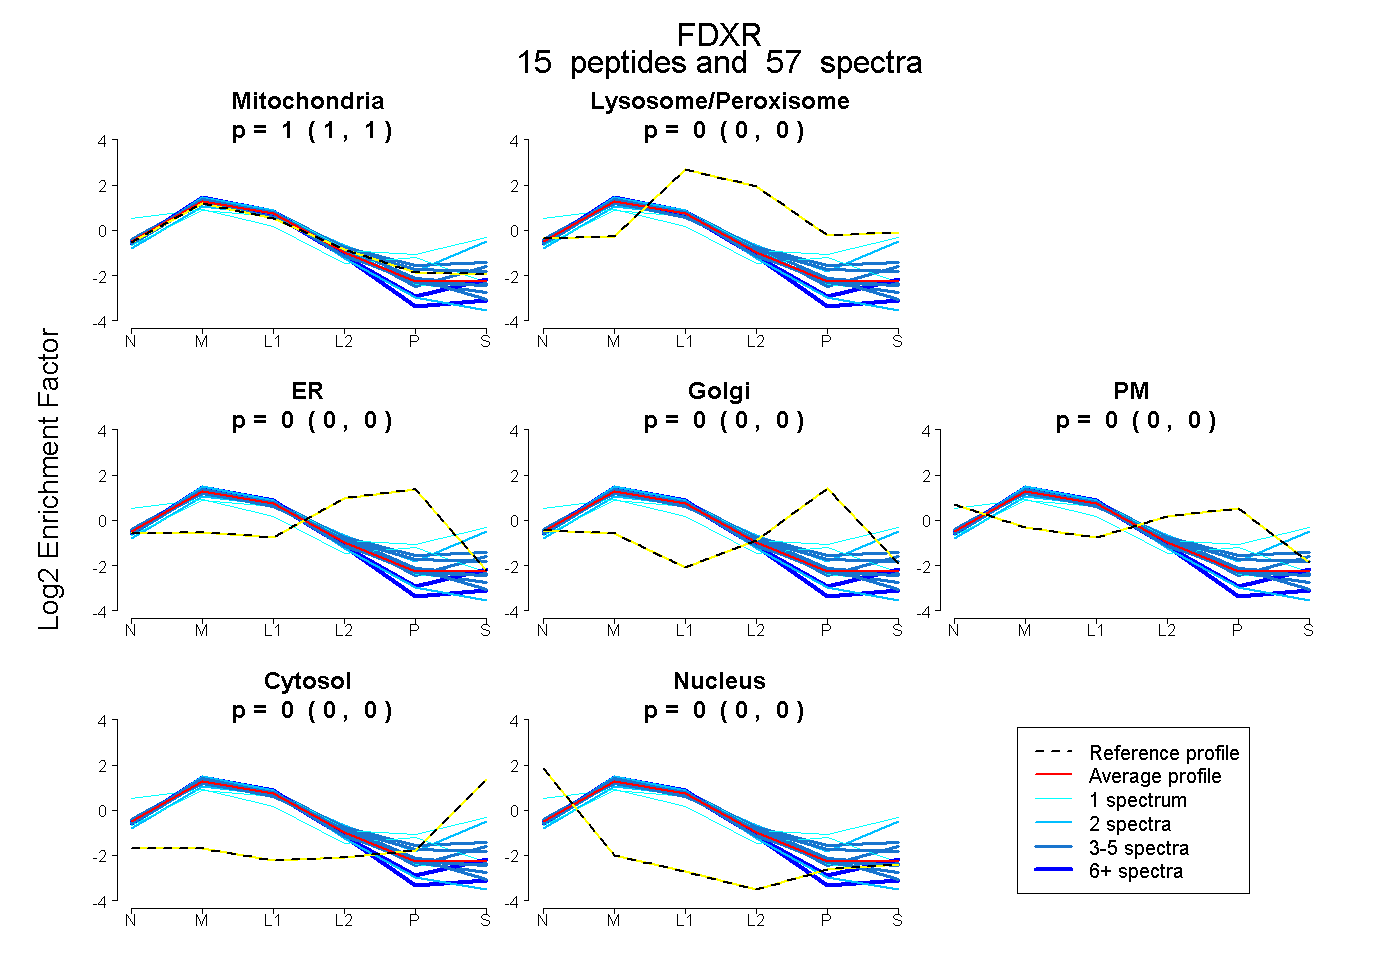 |
1.000
0.998 | 1.000 |
|
0.000
0.000 | 0.000 |
|
0.000
0.000 | 0.000 |
0.000
0.000 | 0.000 |
0.000
0.000 | 0.000 |
0.000
0.000 | 0.000 |
0.000
0.000 | 0.002 |
|
| 5 spectra, TVWIVGR |
1.000 |
|
0.000 |
|
0.000 |
0.000 |
0.000 |
0.000 |
0.000 |
|
| 7 spectra, NVINTFTQTAR |
0.984 |
|
0.000 |
|
0.000 |
0.000 |
0.000 |
0.000 |
0.016 |
|
| 14 spectra, LTELLLR |
0.987 |
|
0.000 |
|
0.000 |
0.000 |
0.000 |
0.000 |
0.013 |
|
| 3 spectra, EMLQLLGH |
0.978 |
|
0.000 |
|
0.000 |
0.000 |
0.000 |
0.022 |
0.000 |
|
| 1 spectrum, LDAEEVAR |
1.000 |
|
0.000 |
|
0.000 |
0.000 |
0.000 |
0.000 |
0.000 |
|
| 1 spectrum, GNVVVGR |
0.694 |
|
0.000 |
|
0.000 |
0.000 |
0.169 |
0.000 |
0.137 |
|
| 3 spectra, TDITEVALGVLR |
0.991 |
|
0.000 |
|
0.000 |
0.000 |
0.000 |
0.000 |
0.009 |
|
| 1 spectrum, GPLQVAFTIK |
0.568 |
|
0.225 |
|
0.000 |
0.000 |
0.000 |
0.207 |
0.000 |
|
| 5 spectra, DVSVPELR |
1.000 |
|
0.000 |
|
0.000 |
0.000 |
0.000 |
0.000 |
0.000 |
|
| 4 spectra, SRPIDPSVPFDPK |
0.964 |
|
0.019 |
|
0.000 |
0.001 |
0.016 |
0.000 |
0.000 |
|
| 2 spectra, QLVPFGLVR |
0.986 |
|
0.000 |
|
0.000 |
0.000 |
0.000 |
0.000 |
0.014 |
|
| 2 spectra, AHVDIYEK |
0.667 |
|
0.173 |
|
0.000 |
0.000 |
0.000 |
0.160 |
0.000 |
|
| 3 spectra, FGVAPDHPEVK |
0.858 |
|
0.095 |
|
0.000 |
0.005 |
0.000 |
0.041 |
0.000 |
|
| 3 spectra, LEGVGESTR |
0.999 |
|
0.000 |
|
0.000 |
0.000 |
0.000 |
0.000 |
0.001 |
|
| 3 spectra, LGIIPNTEGR |
1.000 |
|
0.000 |
|
0.000 |
0.000 |
0.000 |
0.000 |
0.000 |
|
| | | Plot |
|
Lyso |
|
|
|
|
|
|
|
Other |
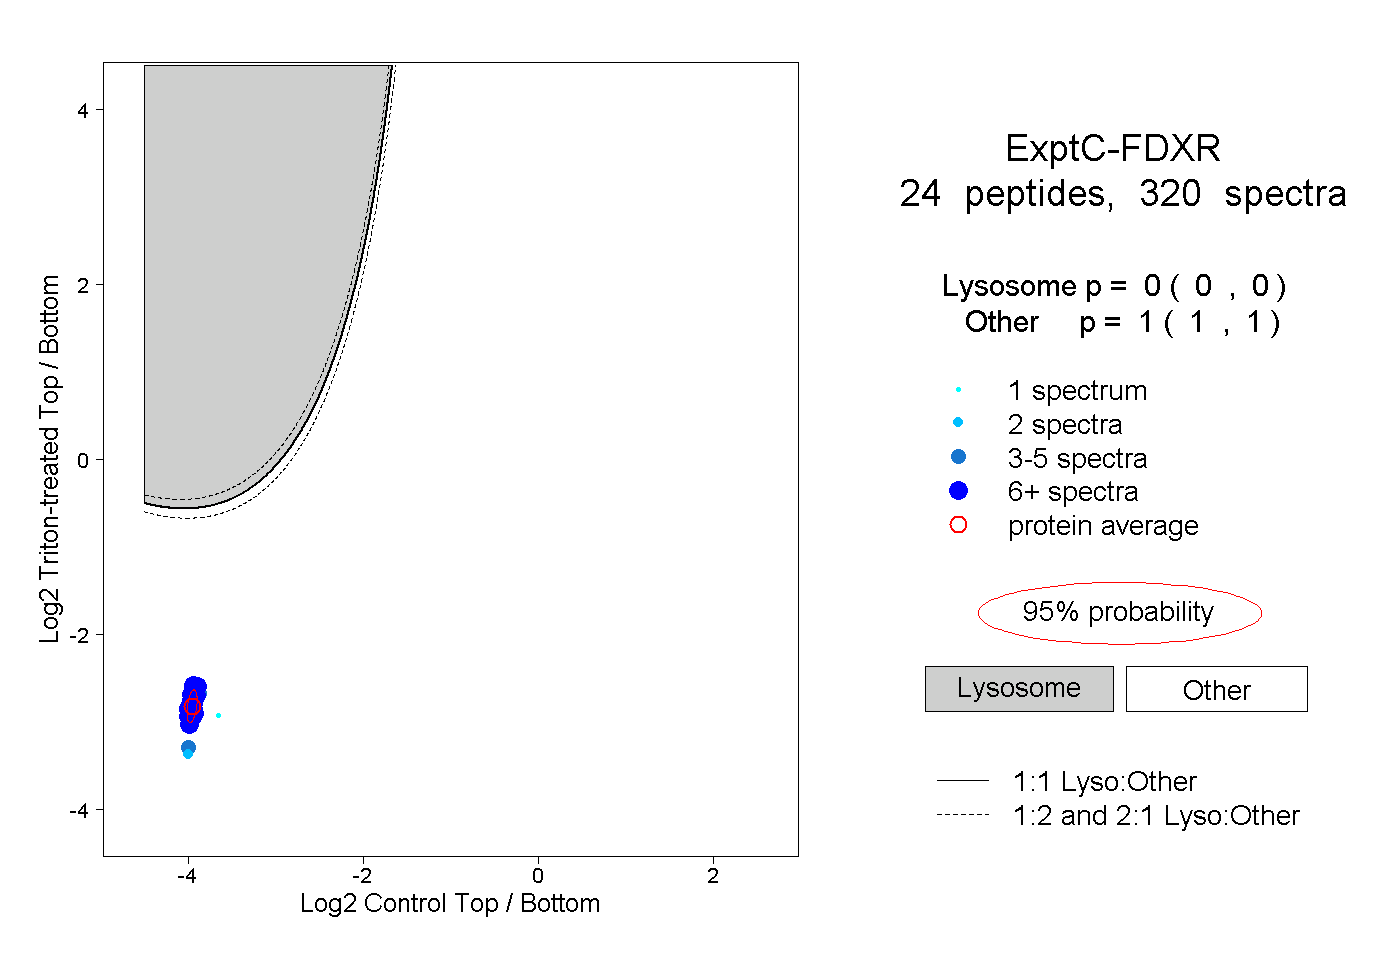
| Expt C |
24
peptides |
320
spectra |
 |
|
0.000
0.000 | 0.000 |
|
|
|
|
|
|
|
1.000
1.000 | 1.000 |
| | | Plot |
|
Lyso |
|
|
|
|
|
|
|
Other |
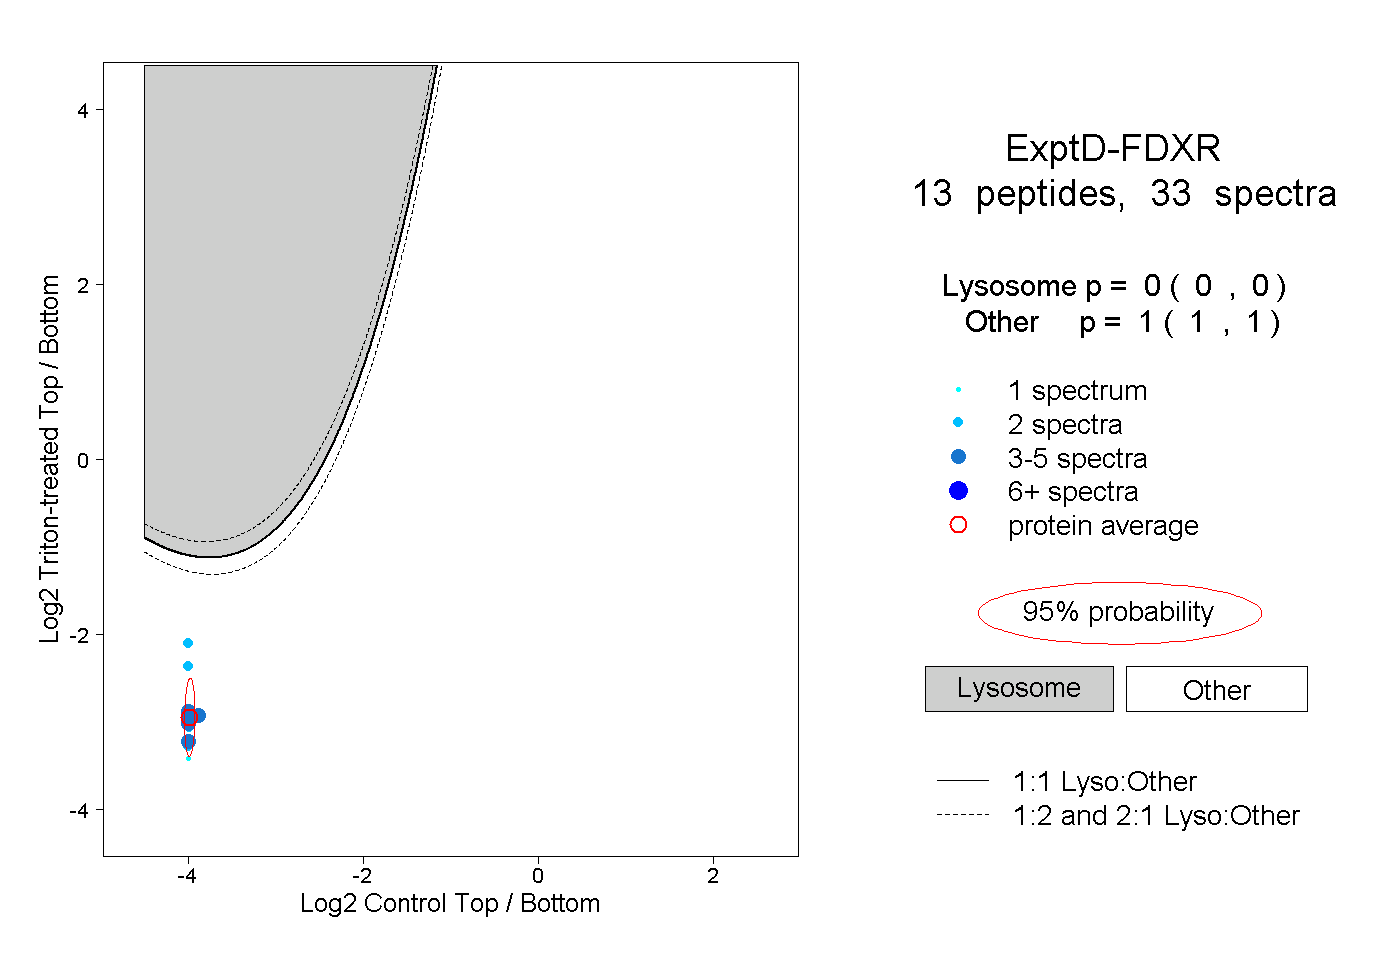
| Expt D |
13
peptides |
33
spectra |
 |
|
0.000
0.000 | 0.000 |
|
|
|
|
|
|
|
1.000
1.000 | 1.000 |