10
10peptides
spectra
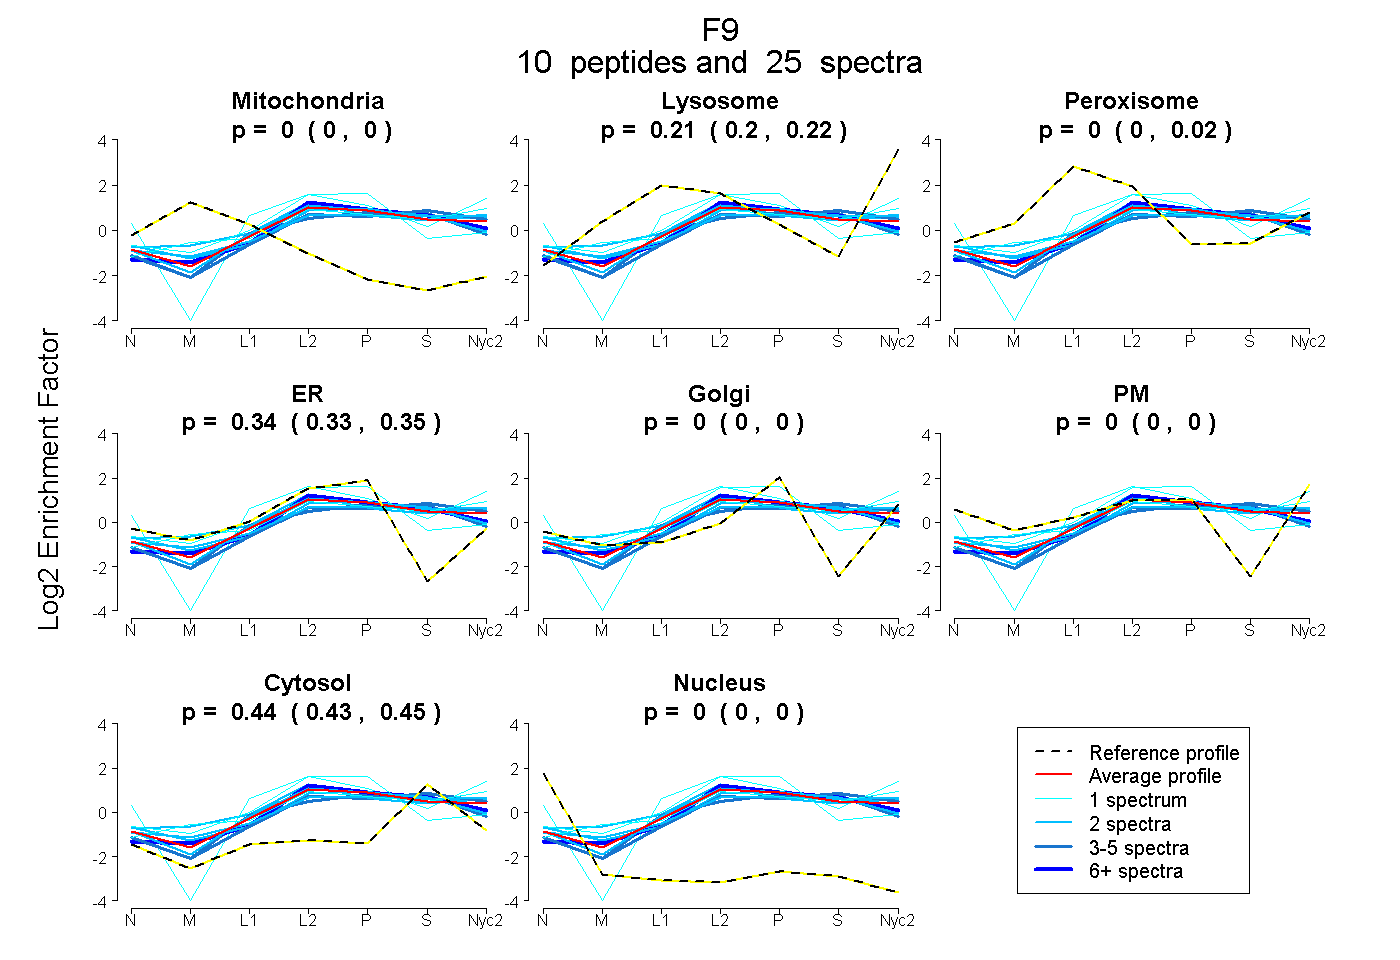
0.000 | 0.000
0.197 | 0.224
0.000 | 0.017
0.330 | 0.349
0.000 | 0.000
0.000 | 0.000
0.434 | 0.449
0.000 | 0.000
5peptides
spectra
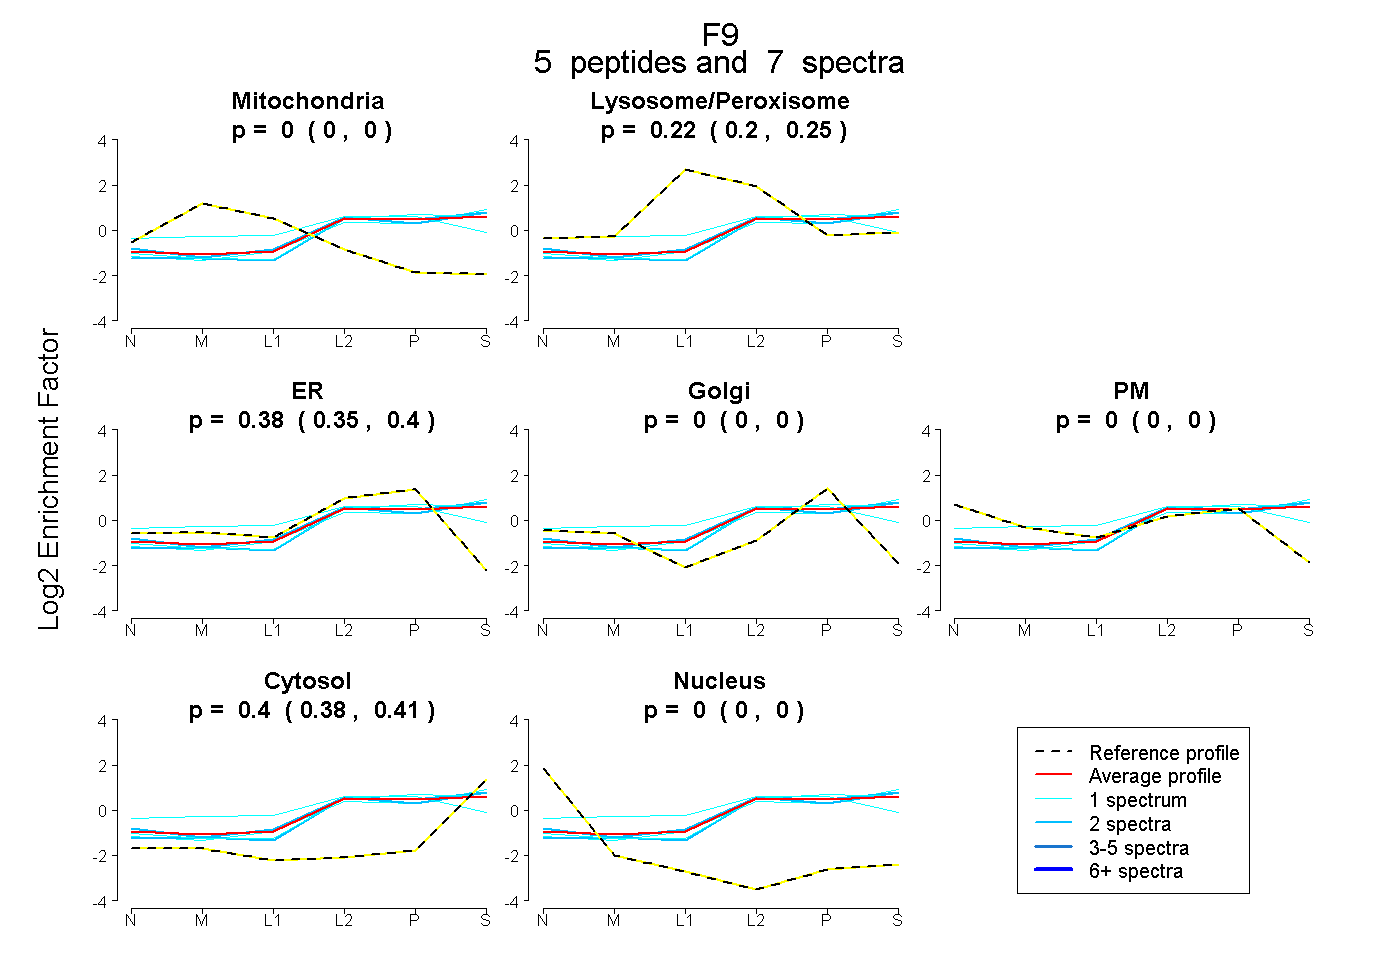
0.000 | 0.000
0.195 | 0.247
0.347 | 0.402
0.000 | 0.000
0.000 | 0.000
0.383 | 0.413
0.000 | 0.000