 10
10peptides
spectra
0.000 | 0.000
0.197 | 0.224
0.000 | 0.017
0.330 | 0.349
0.000 | 0.000
0.000 | 0.000
0.434 | 0.449
0.000 | 0.000
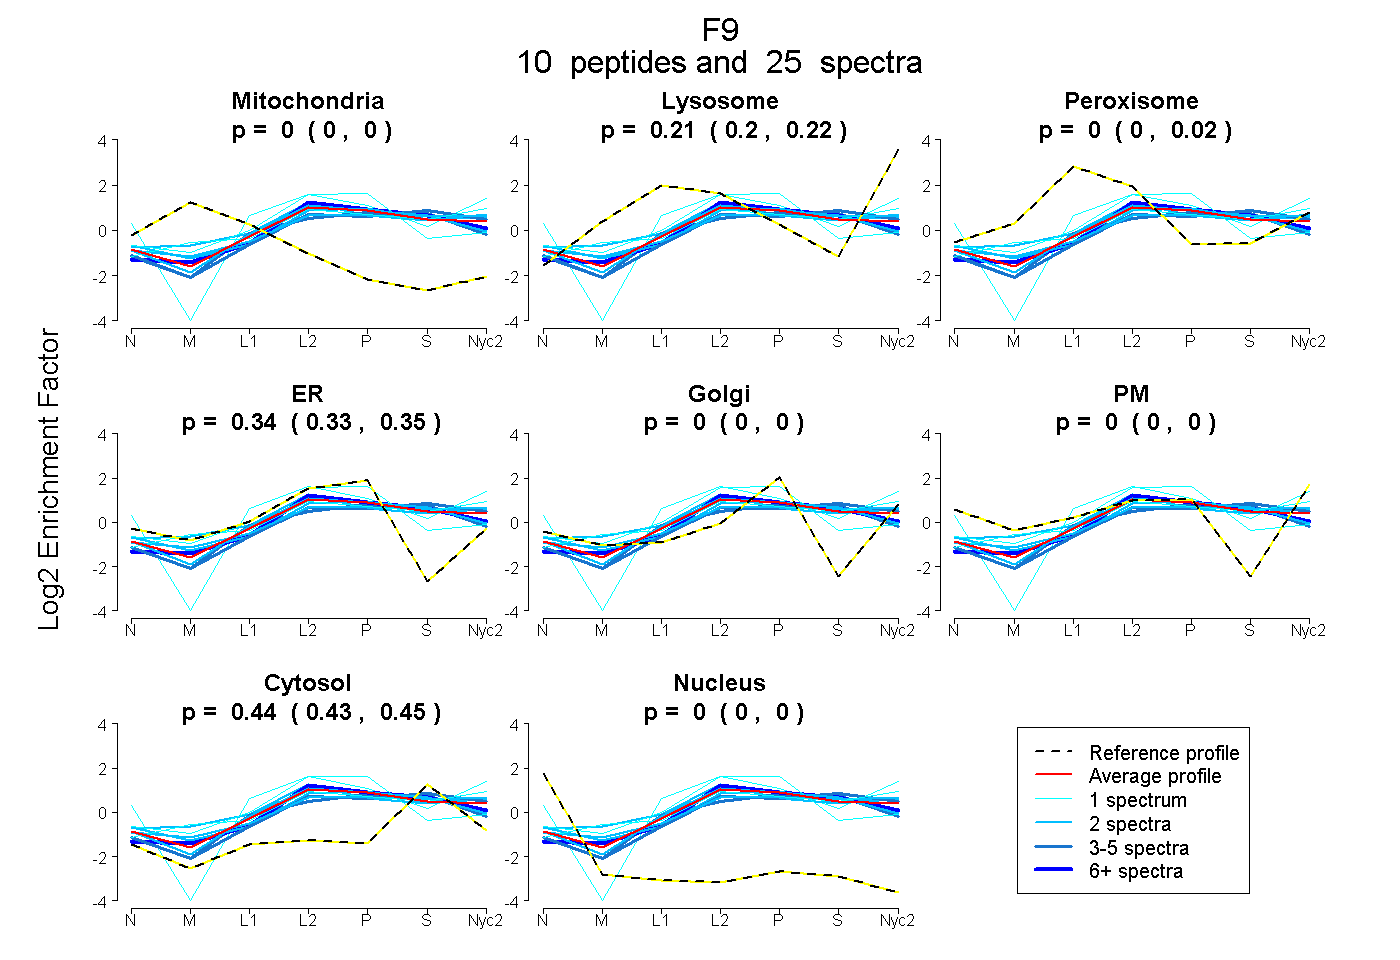
| Plot | Mito | Lyso | Perox | ER | Golgi | PM | Cytosol | Nucleus | |||||
| Expt A |
10 peptides |
25 spectra |
|
0.000 0.000 | 0.000 |
0.215 0.197 | 0.224 |
0.002 0.000 | 0.017 |
0.341 0.330 | 0.349 |
0.000 0.000 | 0.000 |
0.000 0.000 | 0.000 |
0.442 0.434 | 0.449 |
0.000 0.000 | 0.000 |
| 2 spectra, SCEPAVPFPCGR | 0.000 | 0.074 | 0.112 | 0.349 | 0.000 | 0.000 | 0.465 | 0.000 | ||
| 4 spectra, FSIYNNMFCAGYR | 0.000 | 0.081 | 0.070 | 0.305 | 0.000 | 0.000 | 0.544 | 0.000 | ||
| 7 spectra, NCELDATCSIK | 0.000 | 0.178 | 0.000 | 0.355 | 0.000 | 0.000 | 0.466 | 0.000 | ||
| 3 spectra, QASILQYLR | 0.000 | 0.204 | 0.000 | 0.232 | 0.000 | 0.000 | 0.564 | 0.000 | ||
| 2 spectra, FGSGYVSGWGK | 0.000 | 0.257 | 0.113 | 0.274 | 0.000 | 0.000 | 0.356 | 0.000 | ||
| 1 spectrum, YVNWIK | 0.000 | 0.372 | 0.000 | 0.227 | 0.000 | 0.000 | 0.401 | 0.000 | ||
| 2 spectra, NSPDNK | 0.000 | 0.216 | 0.000 | 0.316 | 0.039 | 0.000 | 0.429 | 0.000 | ||
| 2 spectra, VSVAYNSK | 0.000 | 0.271 | 0.000 | 0.239 | 0.019 | 0.000 | 0.471 | 0.000 | ||
| 1 spectrum, TTEFWK | 0.000 | 0.057 | 0.114 | 0.605 | 0.000 | 0.000 | 0.224 | 0.000 | ||
| 1 spectrum, EYTNIFLK | 0.000 | 0.157 | 0.011 | 0.209 | 0.000 | 0.252 | 0.371 | 0.000 |
| Plot | Mito | Lyso or Perox | ER | Golgi | PM | Cytosol | Nucleus | ||||||
| Expt B |
5 peptides |
7 spectra |
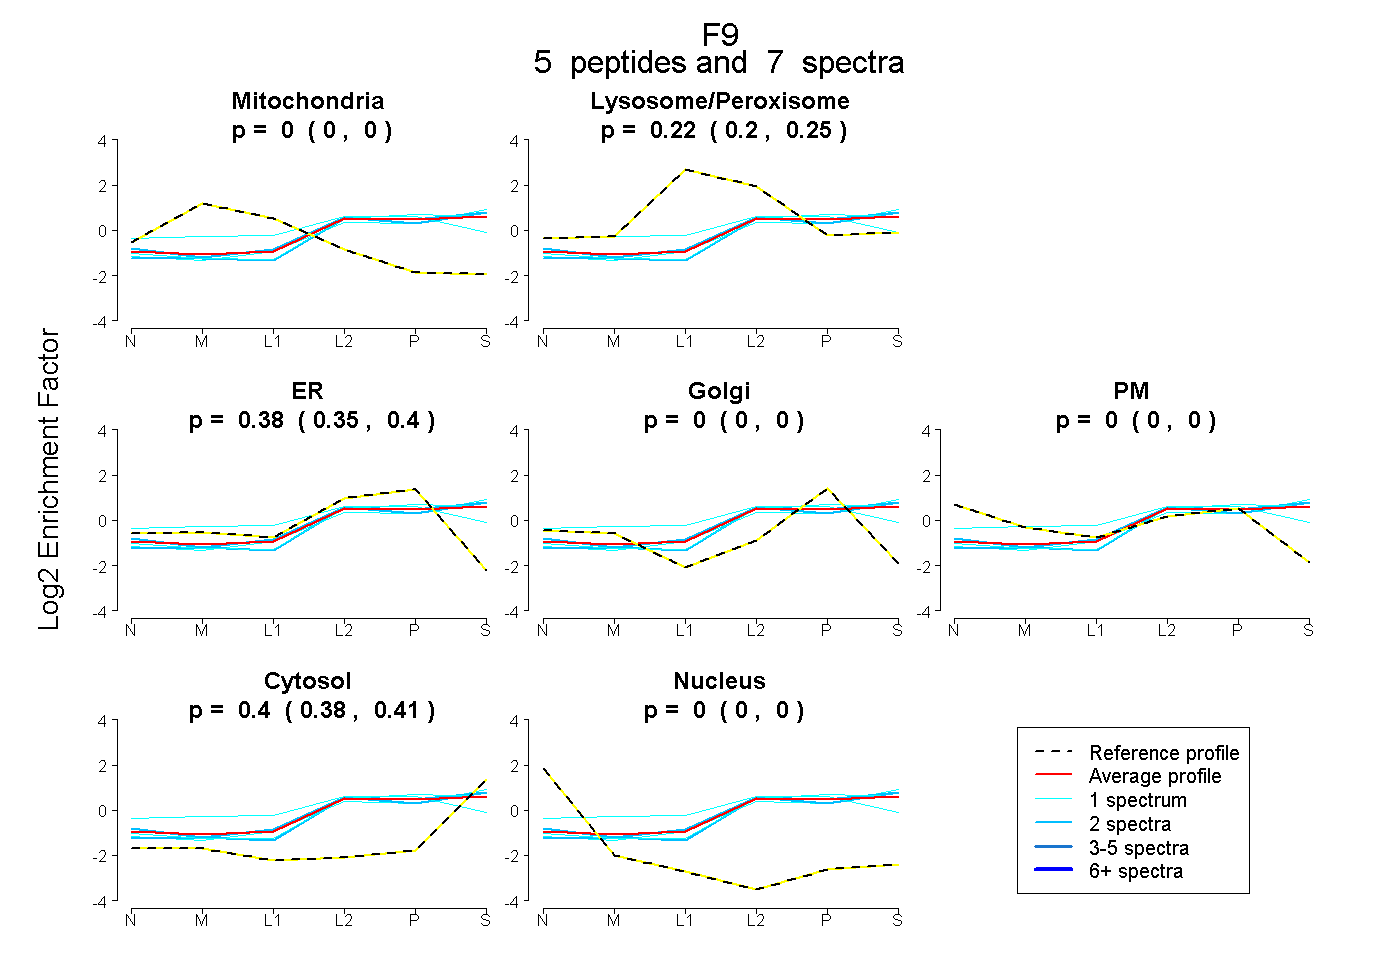 |
0.000 0.000 | 0.000 |
0.224 0.195 | 0.247 |
0.377 0.347 | 0.402 |
0.000 0.000 | 0.000 |
0.000 0.000 | 0.000 |
0.399 0.383 | 0.413 |
0.000 0.000 | 0.000 |
|||
| Plot | Lyso | Other | |||||||||||
| Expt C |
11 peptides |
42 spectra |
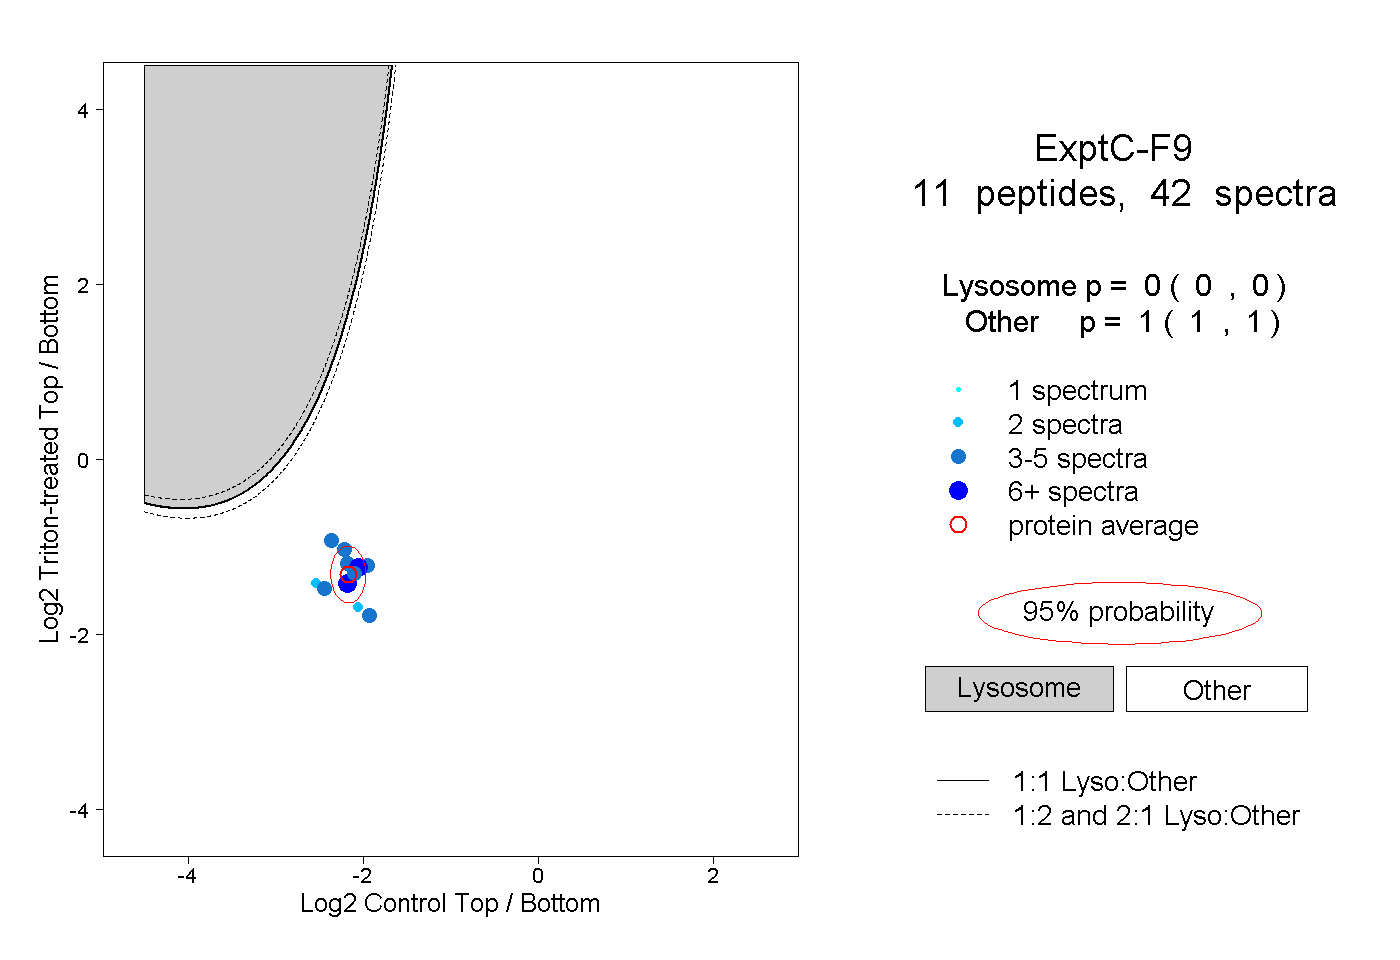 |
0.000 0.000 | 0.000 |
1.000 1.000 | 1.000 |
||||||||
| Plot | Lyso | Other | |||||||||||
| Expt D |
8 peptides |
10 spectra |
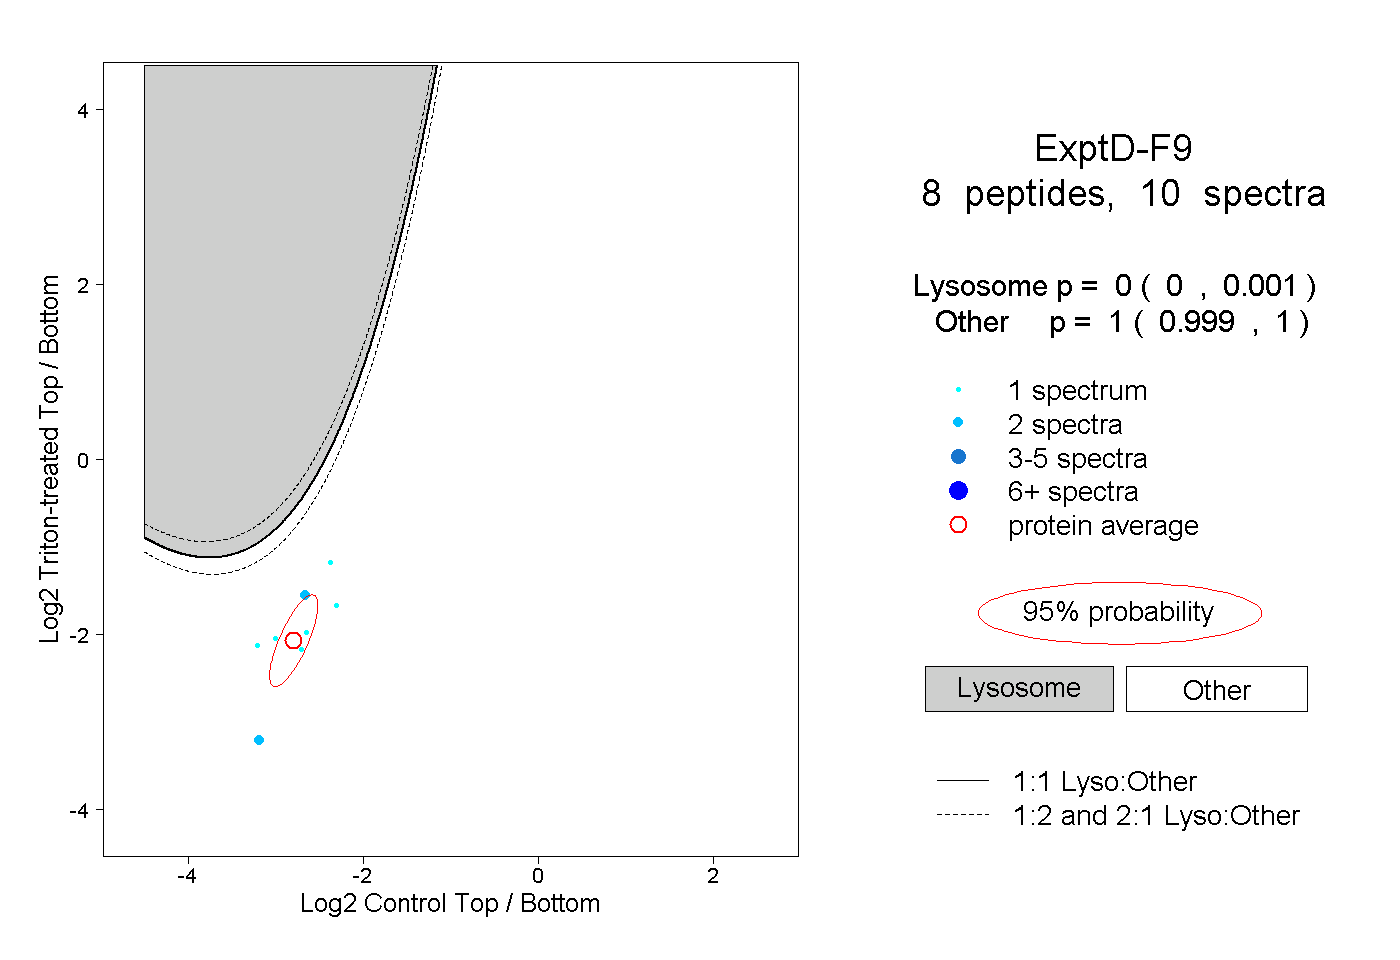 |
0.000 0.000 | 0.001 |
1.000 0.999 | 1.000 |