 3
3peptides
spectra
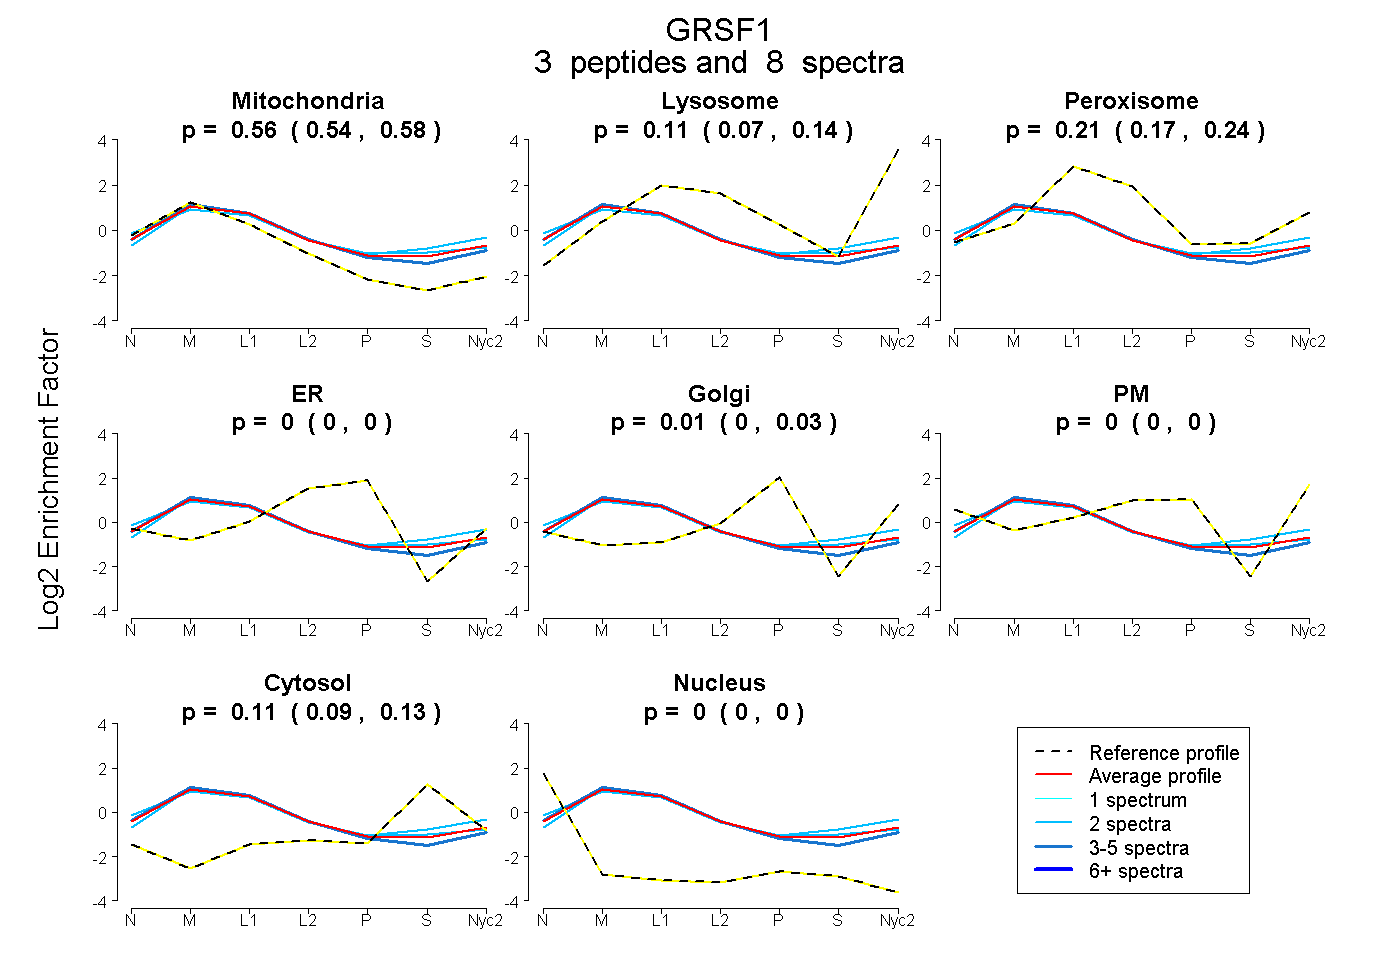
0.539 | 0.580
0.068 | 0.142
0.167 | 0.236
0.000 | 0.000
0.000 | 0.033
0.000 | 0.000
0.089 | 0.129
0.000 | 0.000
1peptide
spectra
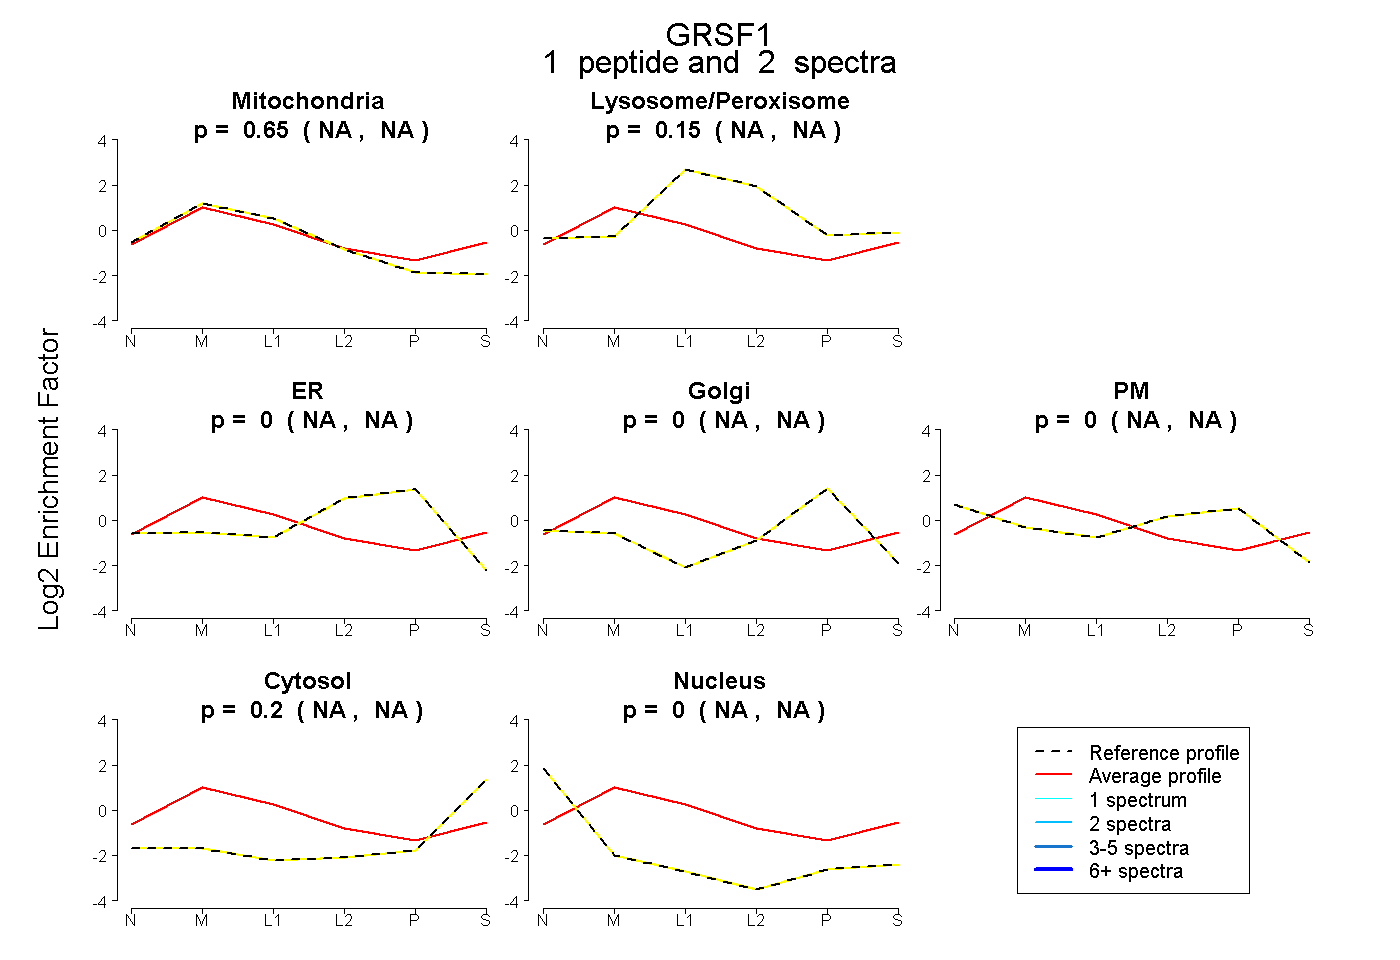
NA | NA
NA | NA
NA | NA
NA | NA
NA | NA
NA | NA
NA | NA
6peptides
spectra
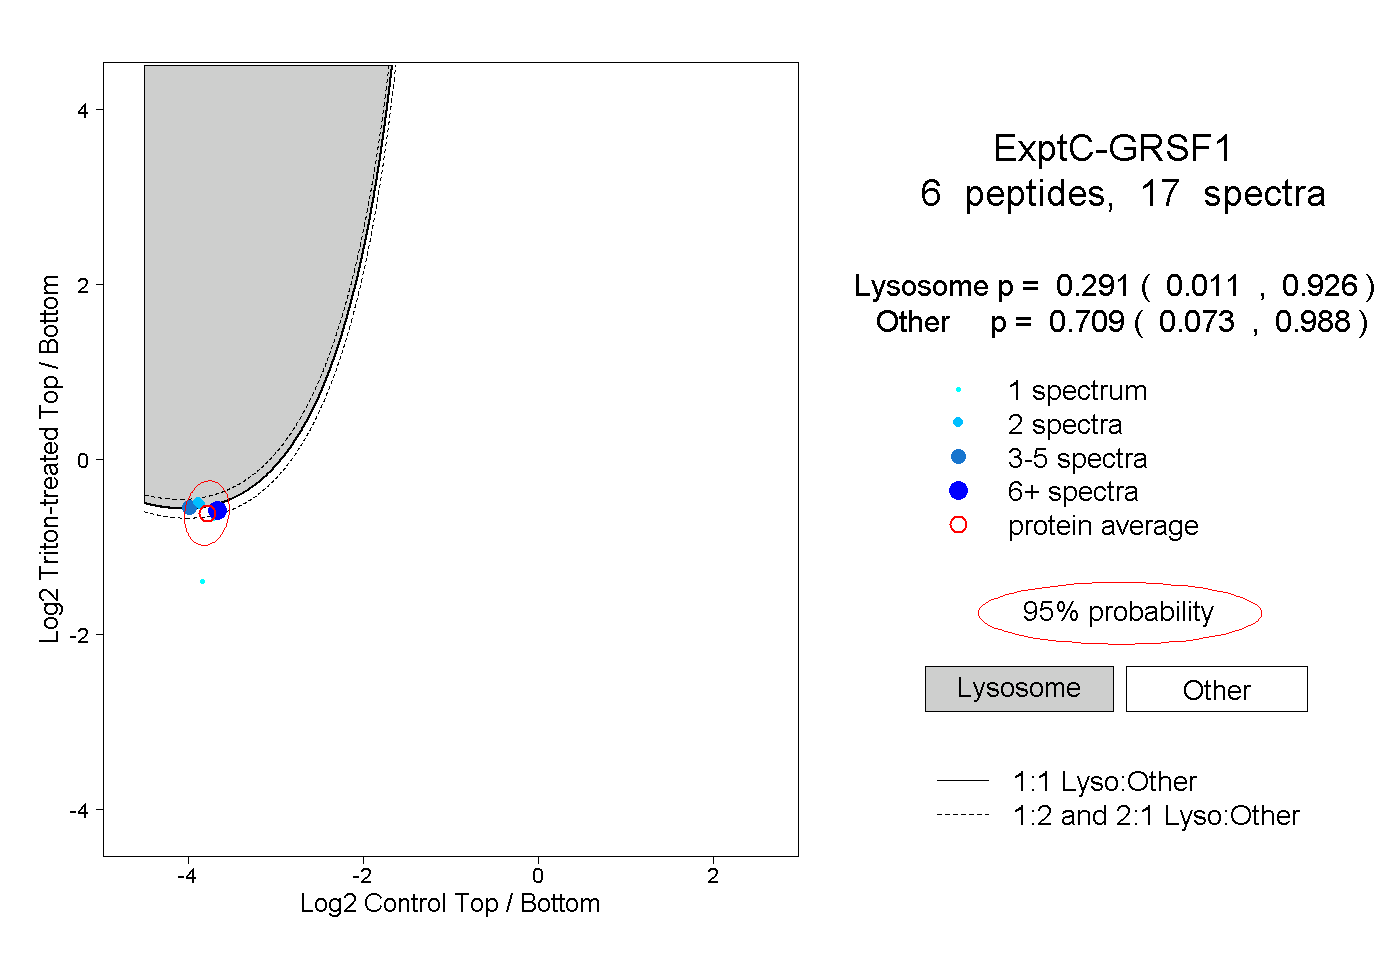
0.011 | 0.926
0.073 | 0.988
2peptides
spectra
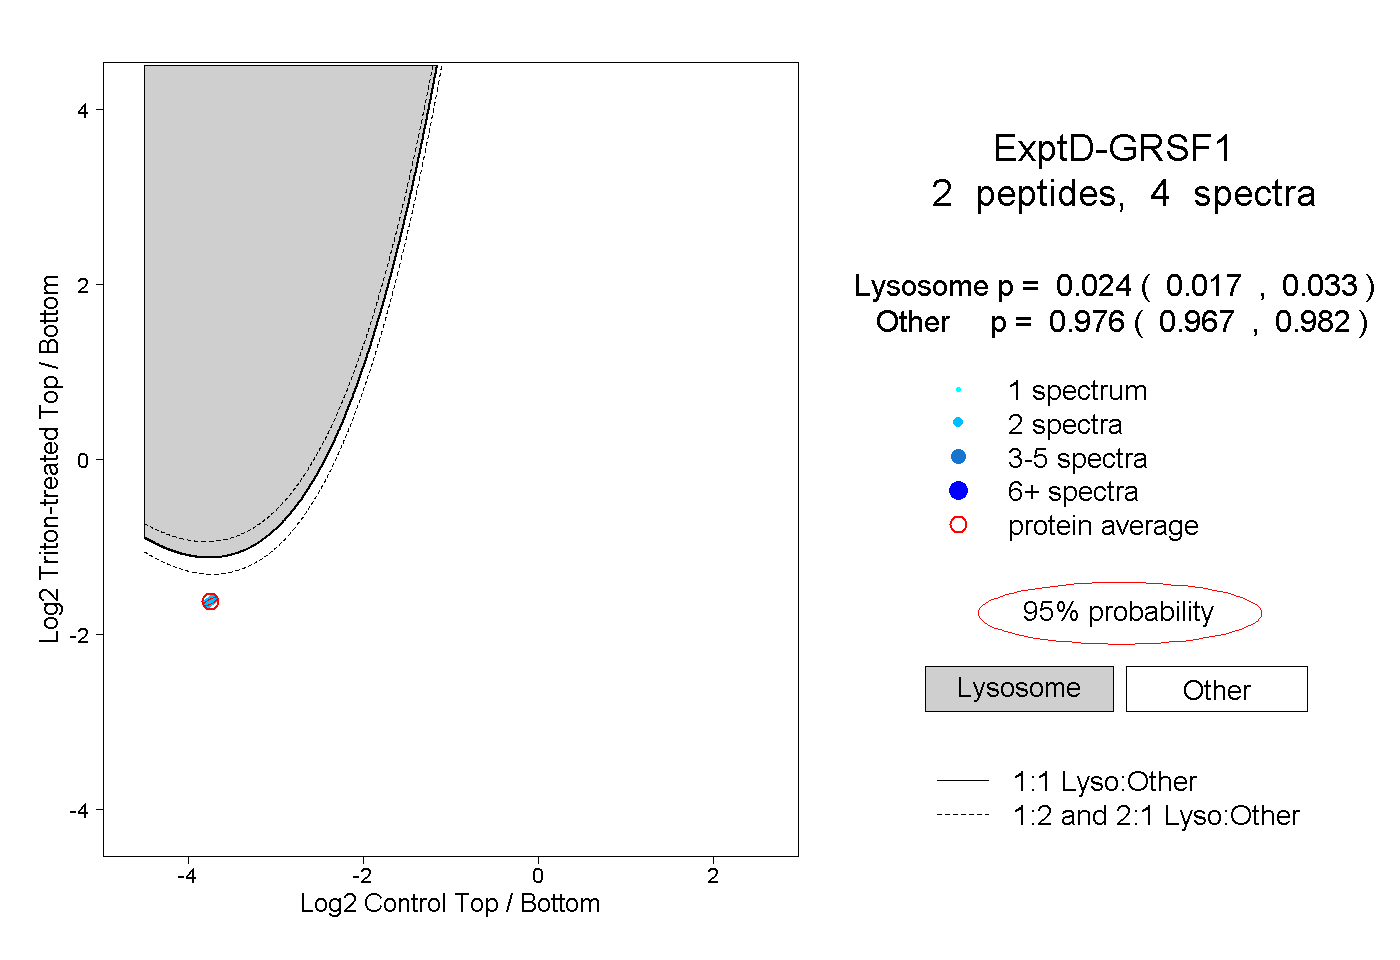
0.017 | 0.033
0.967 | 0.982