 12
12peptides
spectra
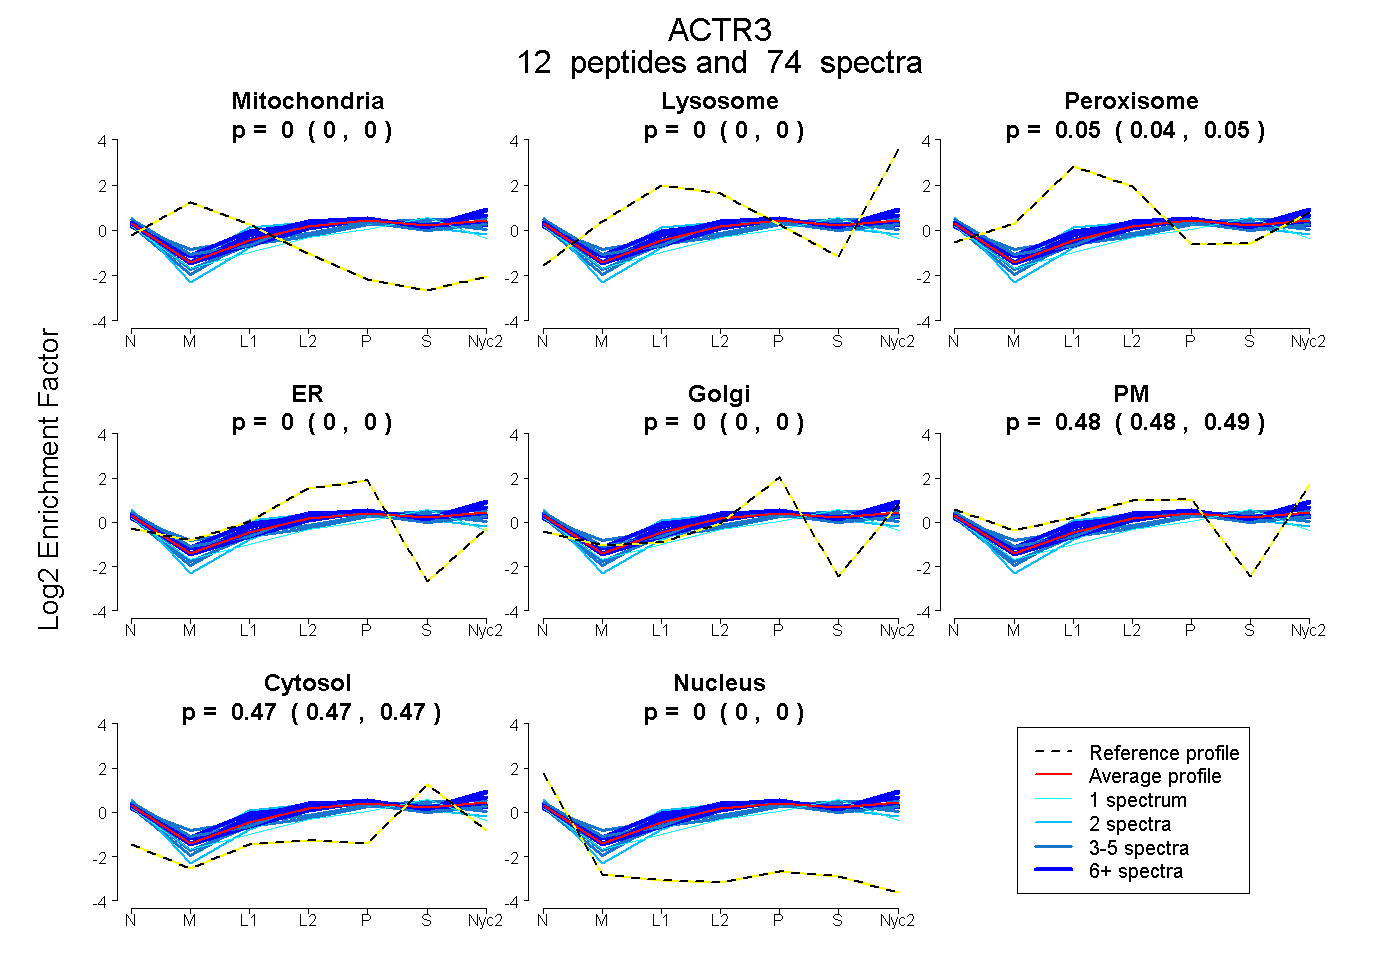
0.000 | 0.000
0.000 | 0.000
0.044 | 0.052
0.000 | 0.000
0.000 | 0.000
0.481 | 0.487
0.465 | 0.470
0.000 | 0.000
13peptides
spectra
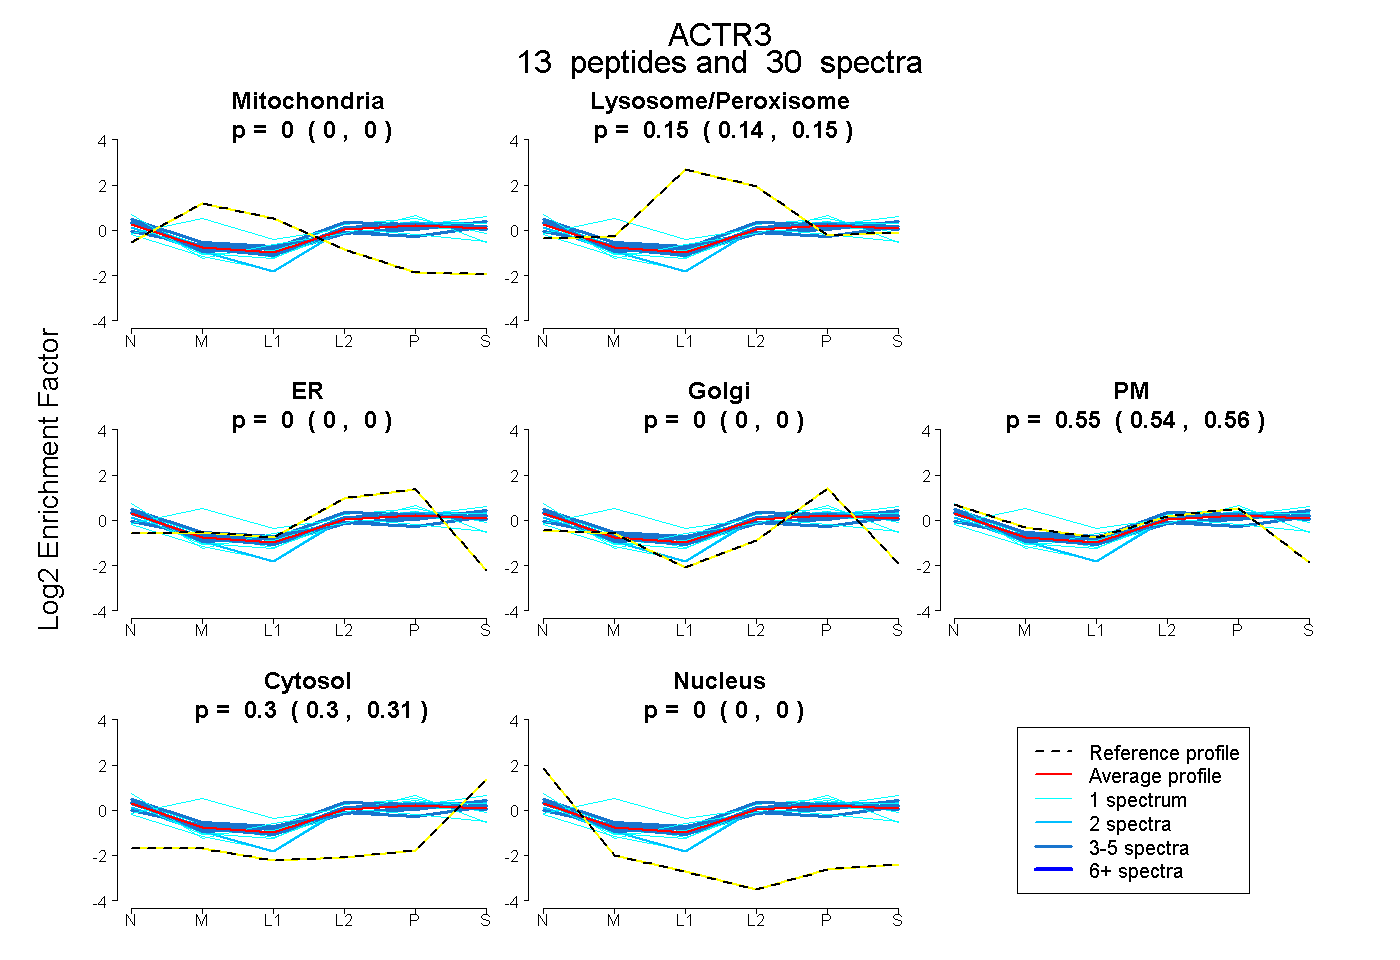
0.000 | 0.000
0.138 | 0.151
0.000 | 0.000
0.000 | 0.000
0.544 | 0.560
0.297 | 0.306
0.000 | 0.000
13peptides
spectra
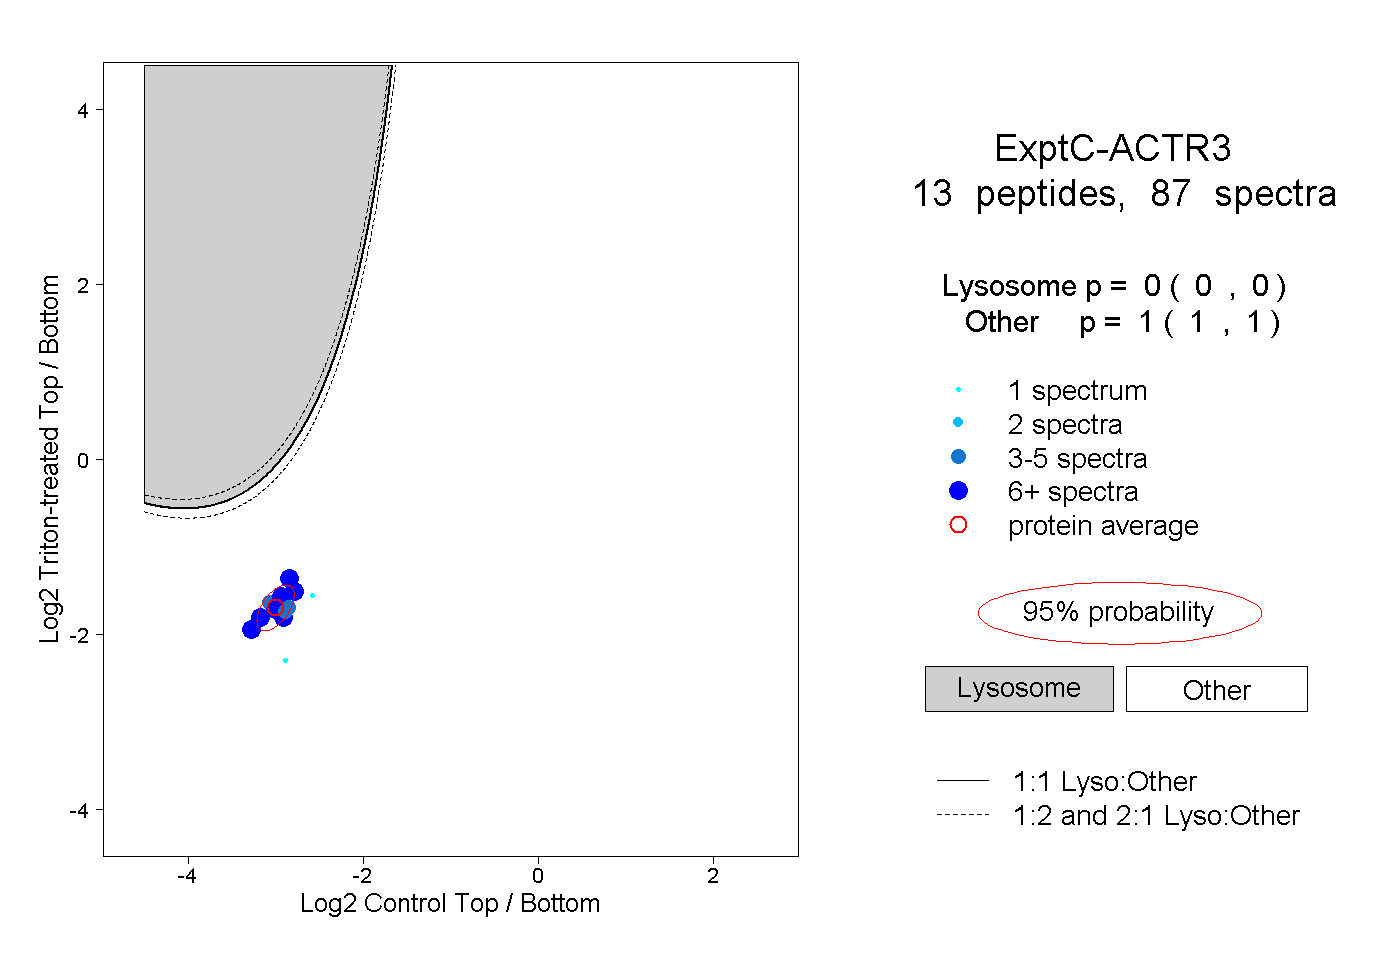
0.000 | 0.000
1.000 | 1.000
4peptides
spectra
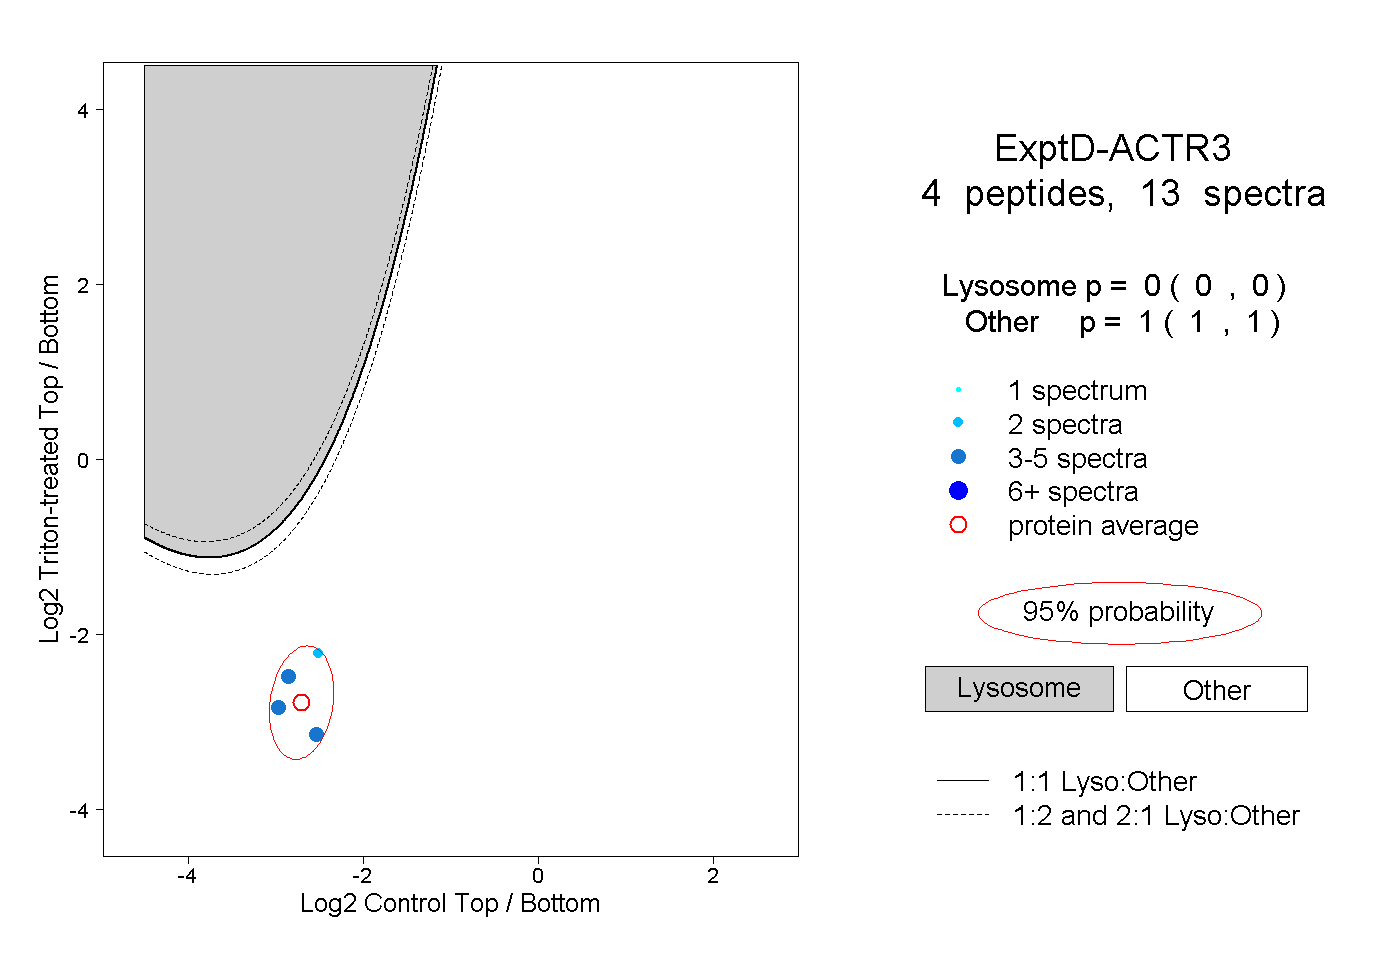
0.000 | 0.000
1.000 | 1.000