5
5peptides
spectra
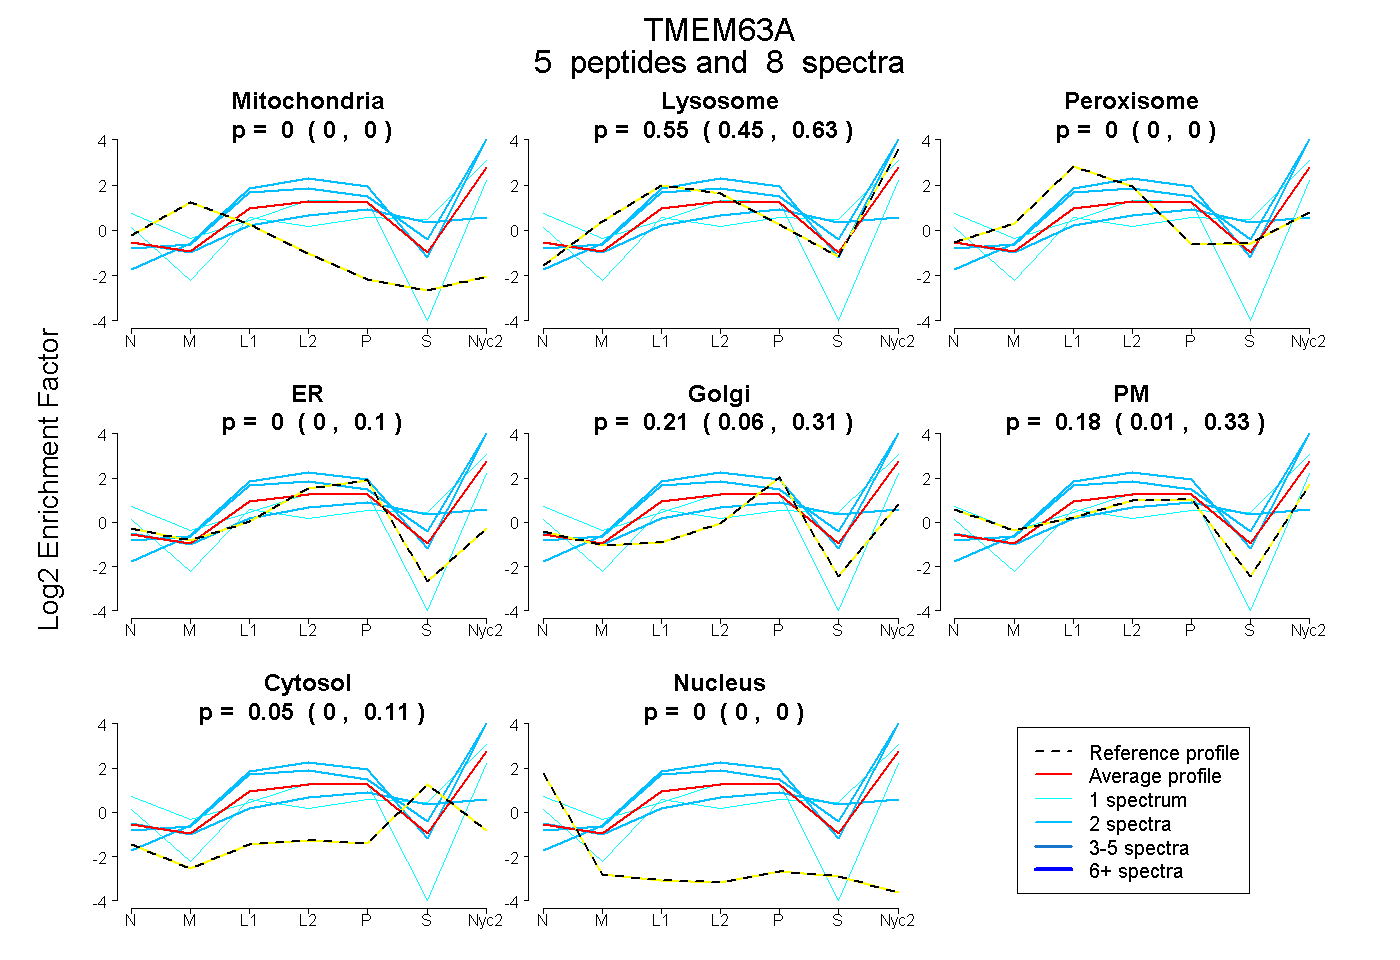
0.000 | 0.000
0.454 | 0.631
0.000 | 0.000
0.000 | 0.105
0.058 | 0.308
0.008 | 0.330
0.000 | 0.108
0.000 | 0.000
1peptide
spectrum
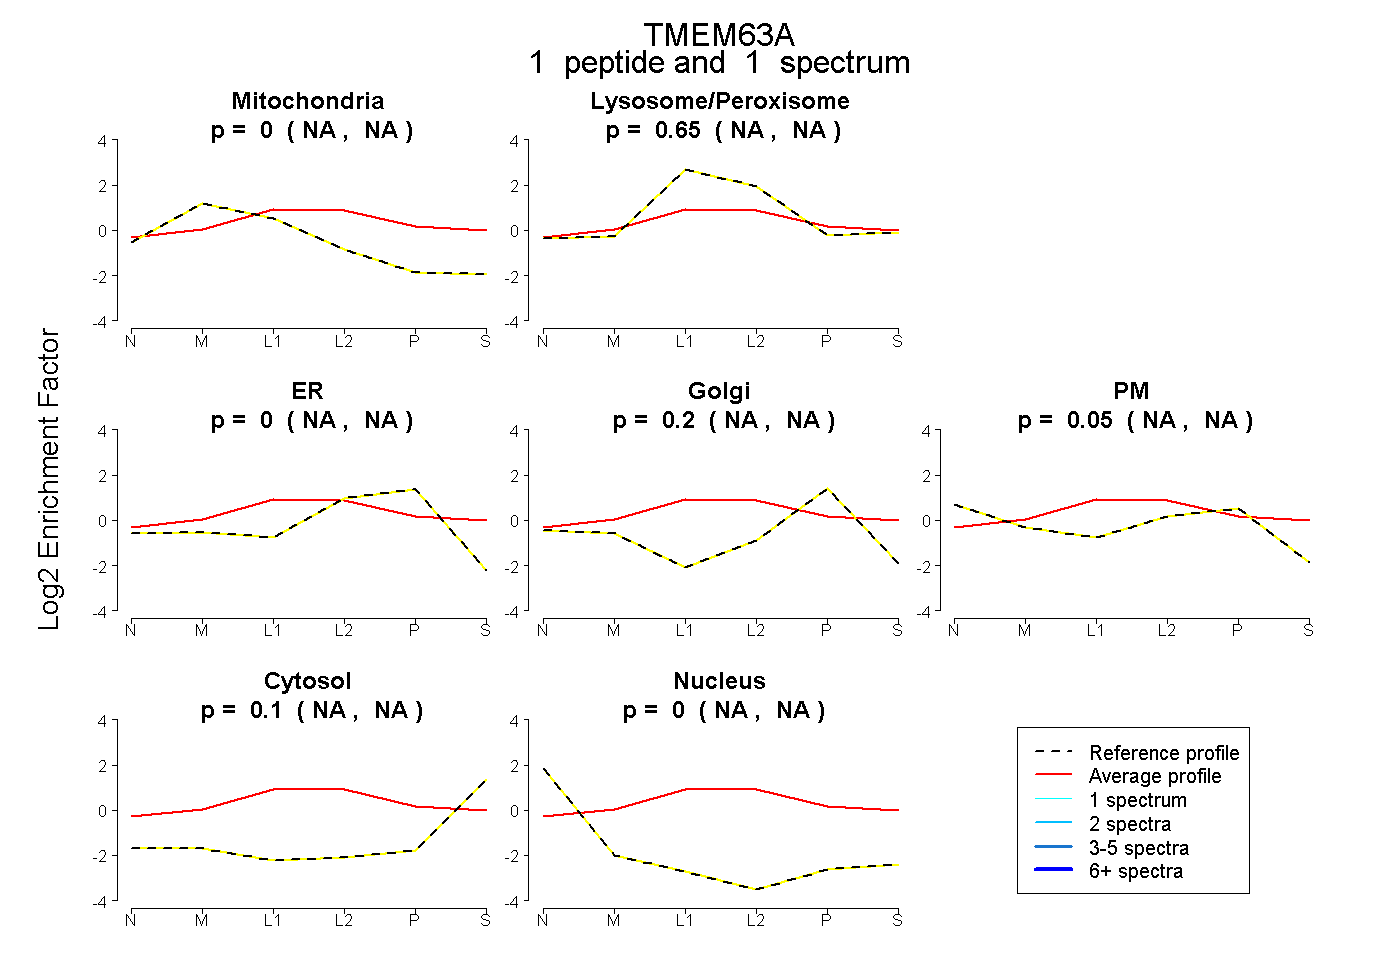
NA | NA
NA | NA
NA | NA
NA | NA
NA | NA
NA | NA
NA | NA
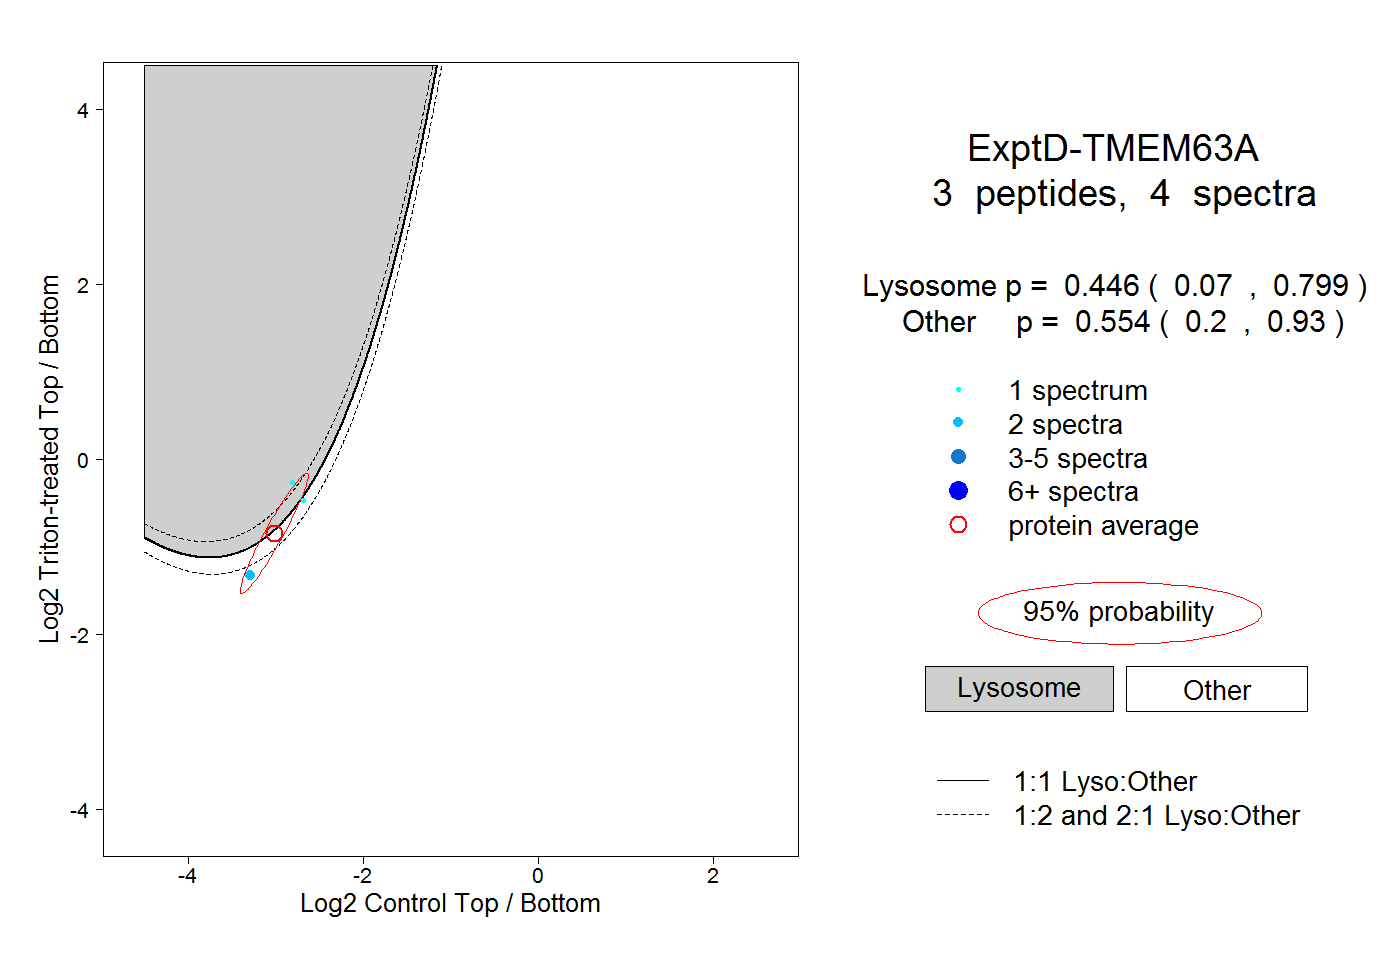
14peptides
spectra
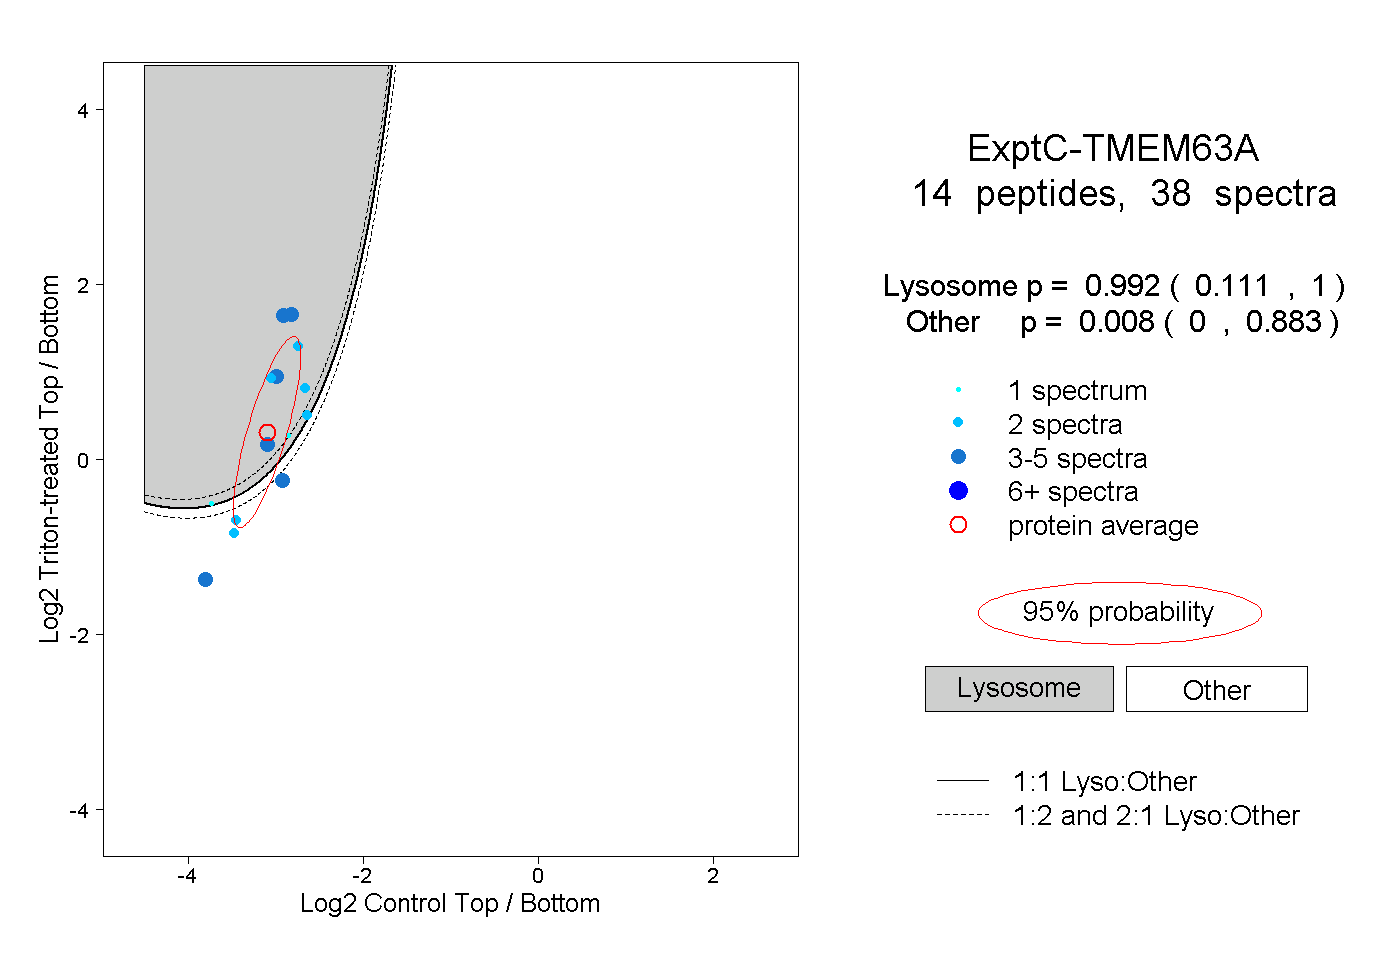
0.111 | 1.000
0.000 | 0.883