 5
5peptides
spectra
0.000 | 0.000
0.000 | 0.043
0.000 | 0.064
0.000 | 0.121
0.029 | 0.175
0.566 | 0.711
0.133 | 0.181
0.000 | 0.000
2peptides
spectra
0.000 | 0.000
1.000 | 1.000
| Plot | Mito | Lyso | Perox | ER | Golgi | PM | Cytosol | Nucleus | |||||
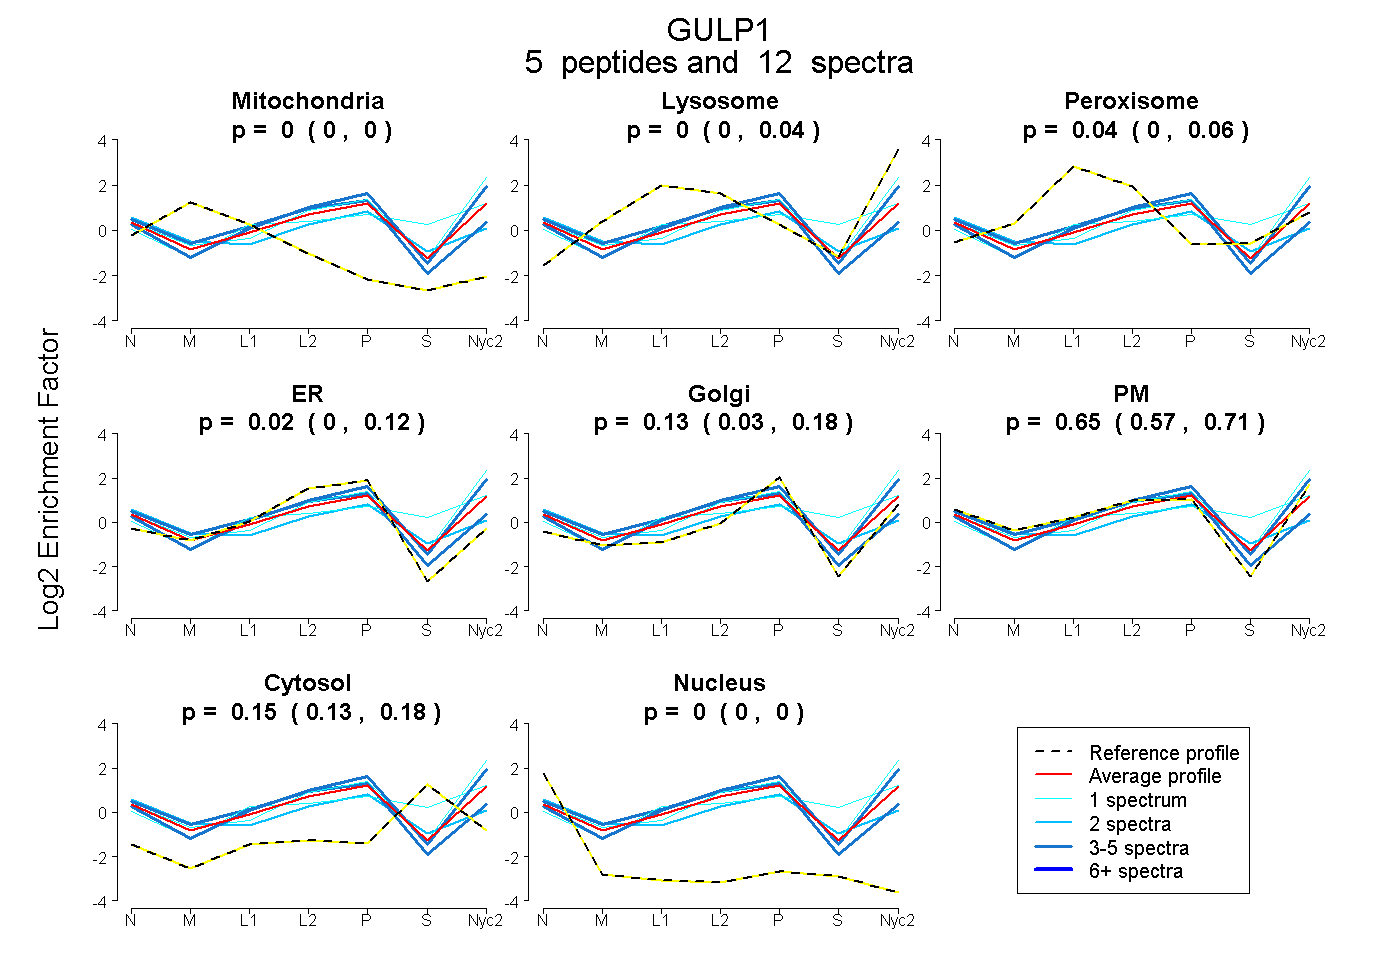
| Expt A |
5 peptides |
12 spectra |
|
0.000 0.000 | 0.000 |
0.000 0.000 | 0.043 |
0.042 0.000 | 0.064 |
0.025 0.000 | 0.121 |
0.130 0.029 | 0.175 |
0.649 0.566 | 0.711 |
0.154 0.133 | 0.181 |
0.000 0.000 | 0.000 |
||
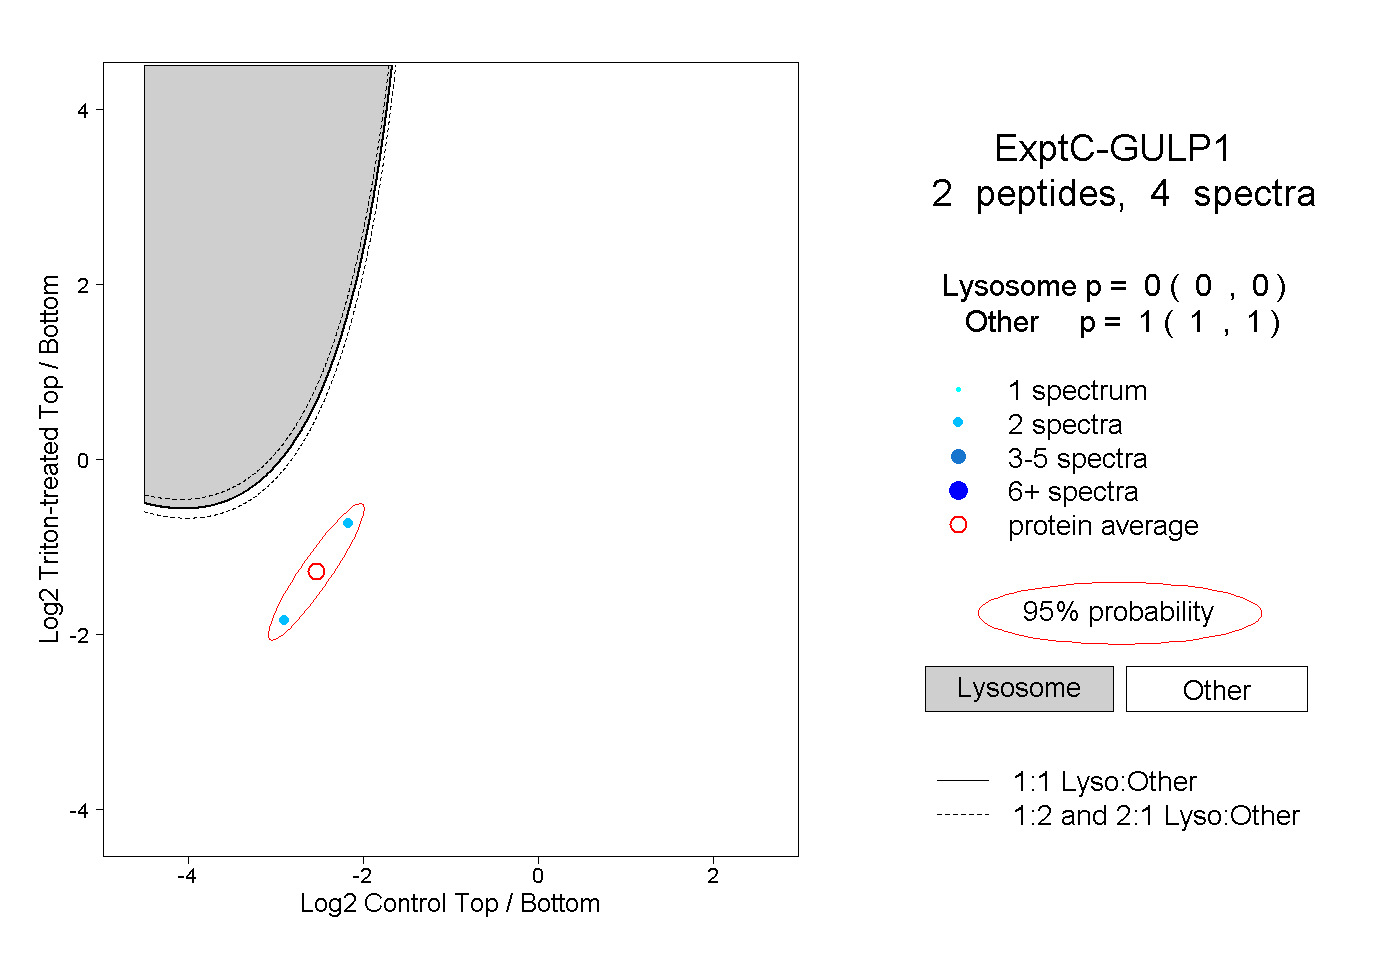
| Plot | Lyso | Other | |||||||||||
| Expt C |
2 peptides |
4 spectra |
|
0.000 0.000 | 0.000 |
1.000 1.000 | 1.000 |