 2
2peptides
spectra
NA | NA
NA | NA
NA | NA
NA | NA
NA | NA
NA | NA
NA | NA
NA | NA
| Plot | Mito | Lyso | Perox | ER | Golgi | PM | Cytosol | Nucleus | |||||
| Expt A |
2 peptides |
2 spectra |
|
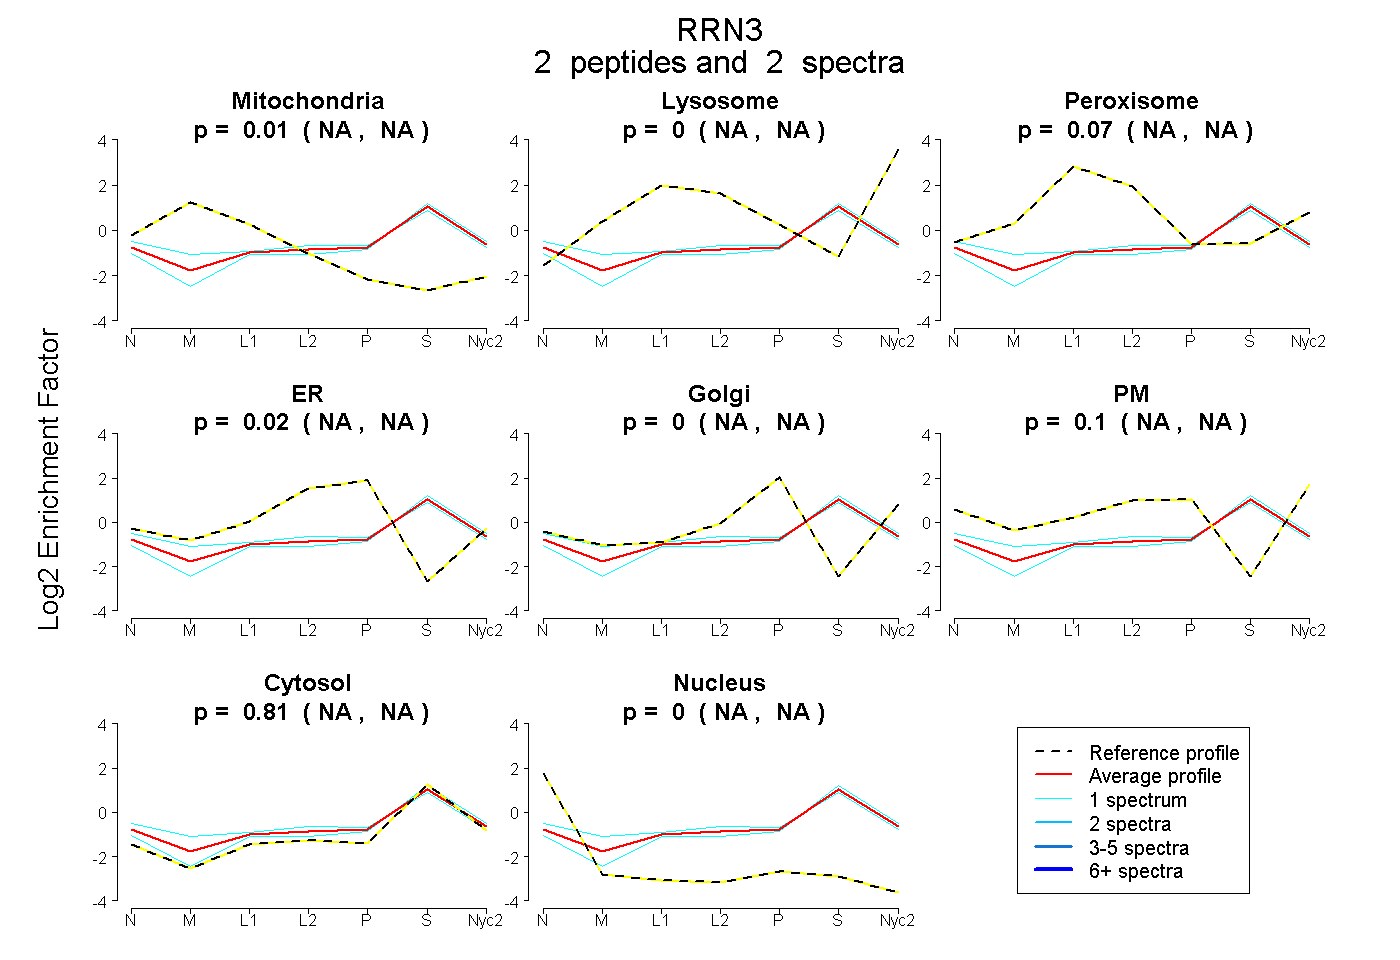
0.007 NA | NA |
0.000 NA | NA |
0.067 NA | NA |
0.017 NA | NA |
0.000 NA | NA |
0.101 NA | NA |
0.808 NA | NA |
0.000 NA | NA |
| 1 spectrum, LPWLNR | 0.000 | 0.000 | 0.021 | 0.000 | 0.011 | 0.077 | 0.891 | 0.000 | ||
| 1 spectrum, FIPLITVK | 0.093 | 0.000 | 0.090 | 0.035 | 0.000 | 0.090 | 0.691 | 0.000 |