8
8peptides
spectra
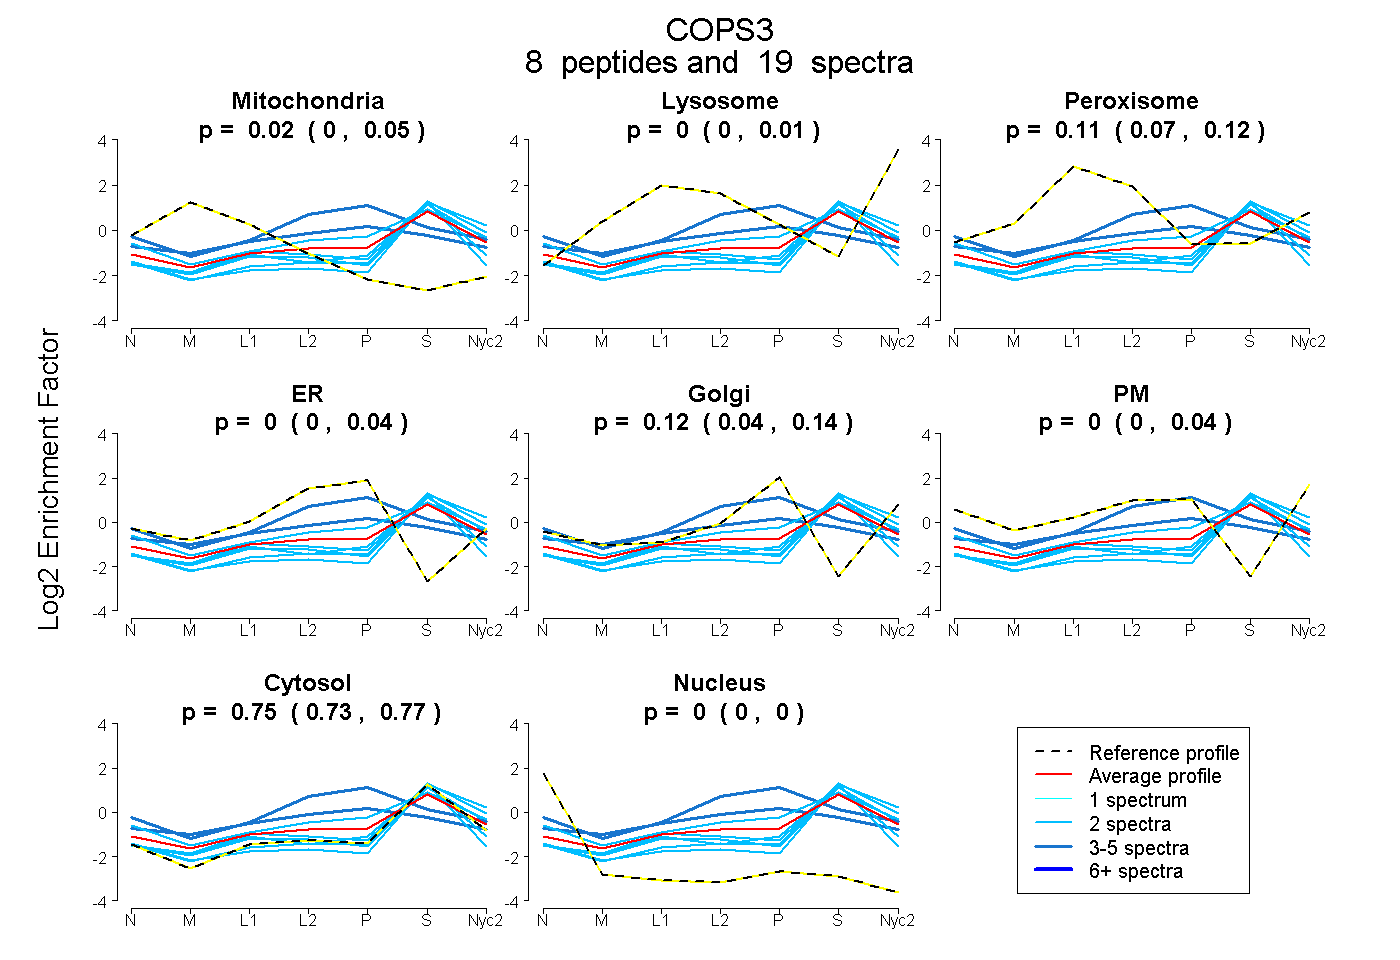
0.000 | 0.046
0.000 | 0.010
0.074 | 0.121
0.000 | 0.038
0.039 | 0.141
0.000 | 0.039
0.730 | 0.772
0.000 | 0.000
3peptides
spectra
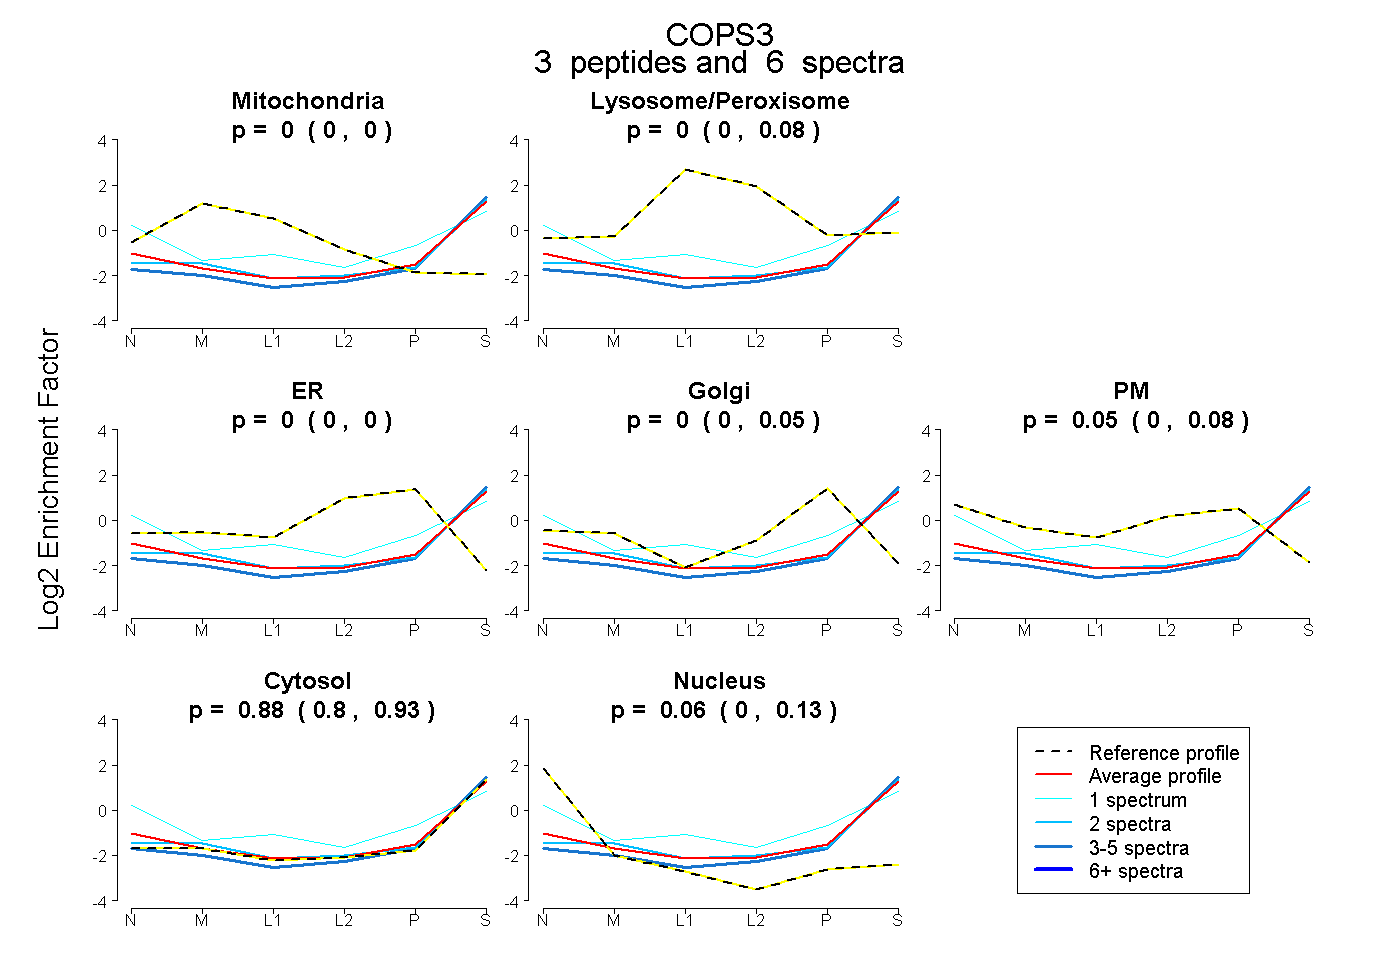
0.000 | 0.000
0.000 | 0.077
0.000 | 0.000
0.000 | 0.054
0.000 | 0.084
0.800 | 0.927
0.001 | 0.126