 8
8peptides
spectra
0.000 | 0.046
0.000 | 0.010
0.074 | 0.121
0.000 | 0.038
0.039 | 0.141
0.000 | 0.039
0.730 | 0.772
0.000 | 0.000
| Plot | Mito | Lyso | Perox | ER | Golgi | PM | Cytosol | Nucleus | |||||
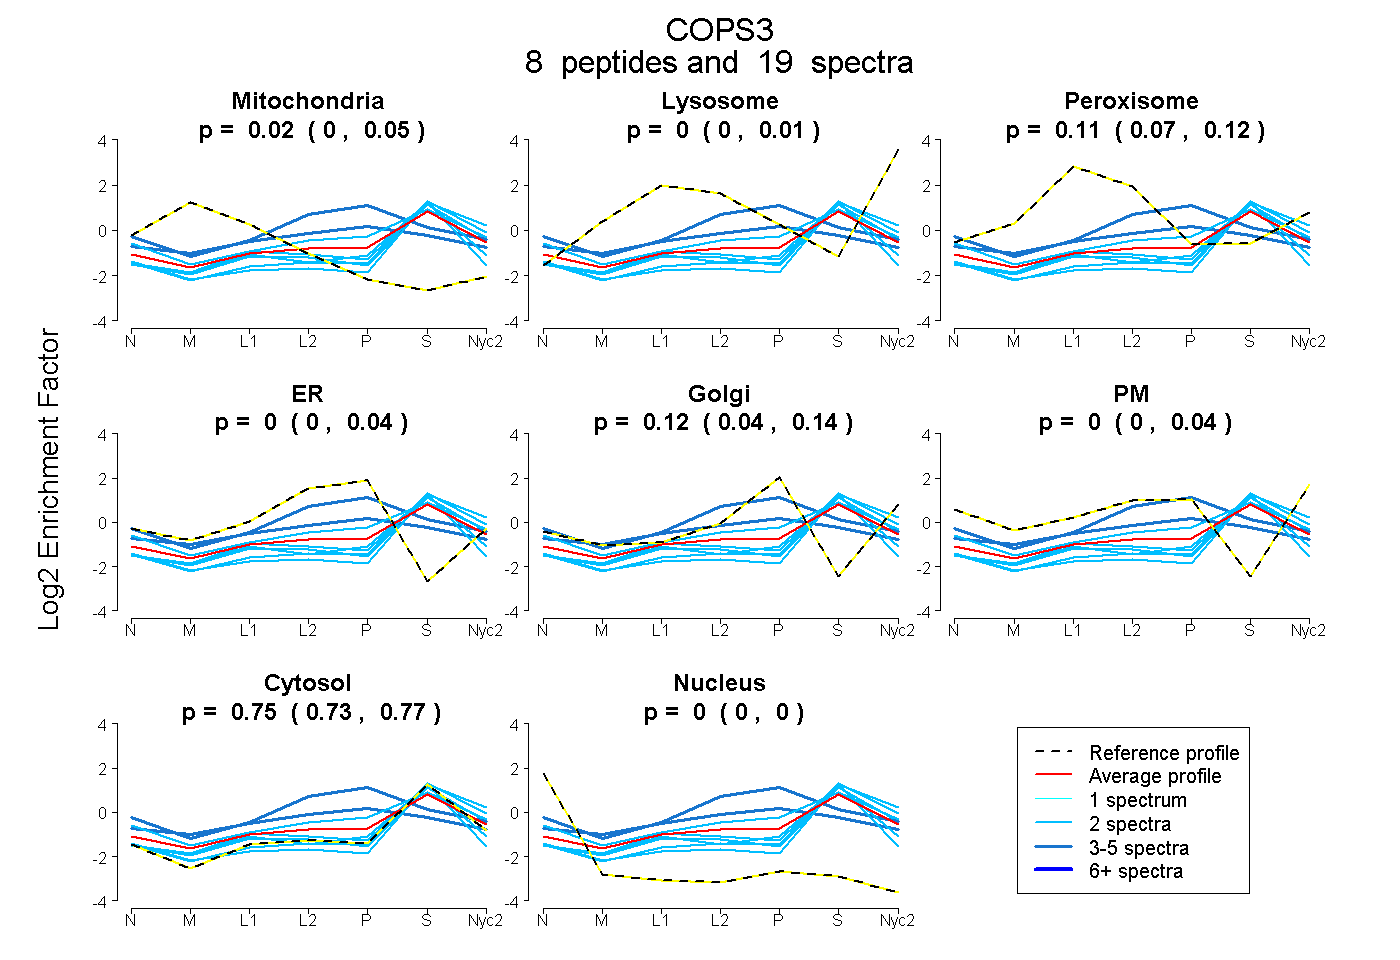
| Expt A |
8 peptides |
19 spectra |
|
0.024 0.000 | 0.046 |
0.000 0.000 | 0.010 |
0.107 0.074 | 0.121 |
0.000 0.000 | 0.038 |
0.117 0.039 | 0.141 |
0.000 0.000 | 0.039 |
0.751 0.730 | 0.772 |
0.000 0.000 | 0.000 |
| 2 spectra, YTSQIVGR | 0.000 | 0.054 | 0.000 | 0.000 | 0.000 | 0.000 | 0.946 | 0.000 | ||
| 2 spectra, AMDQEITVNPQFVQK | 0.036 | 0.069 | 0.000 | 0.000 | 0.000 | 0.000 | 0.895 | 0.000 | ||
| 2 spectra, HSETFTR | 0.000 | 0.000 | 0.085 | 0.043 | 0.037 | 0.142 | 0.693 | 0.000 | ||
| 4 spectra, DNNMGLVK | 0.000 | 0.000 | 0.091 | 0.507 | 0.000 | 0.000 | 0.402 | 0.000 | ||
| 2 spectra, TFLTLSLQDMASR | 0.000 | 0.160 | 0.000 | 0.000 | 0.000 | 0.000 | 0.840 | 0.000 | ||
| 2 spectra, QCLSSLYK | 0.005 | 0.000 | 0.000 | 0.000 | 0.000 | 0.000 | 0.908 | 0.087 | ||
| 3 spectra, GIGILK | 0.077 | 0.000 | 0.074 | 0.343 | 0.025 | 0.000 | 0.481 | 0.000 | ||
| 2 spectra, YATDTFAGLCHQLTNALVER | 0.078 | 0.000 | 0.020 | 0.000 | 0.000 | 0.000 | 0.902 | 0.000 |
| Plot | Mito | Lyso or Perox | ER | Golgi | PM | Cytosol | Nucleus | ||||||
| Expt B |
3 peptides |
6 spectra |
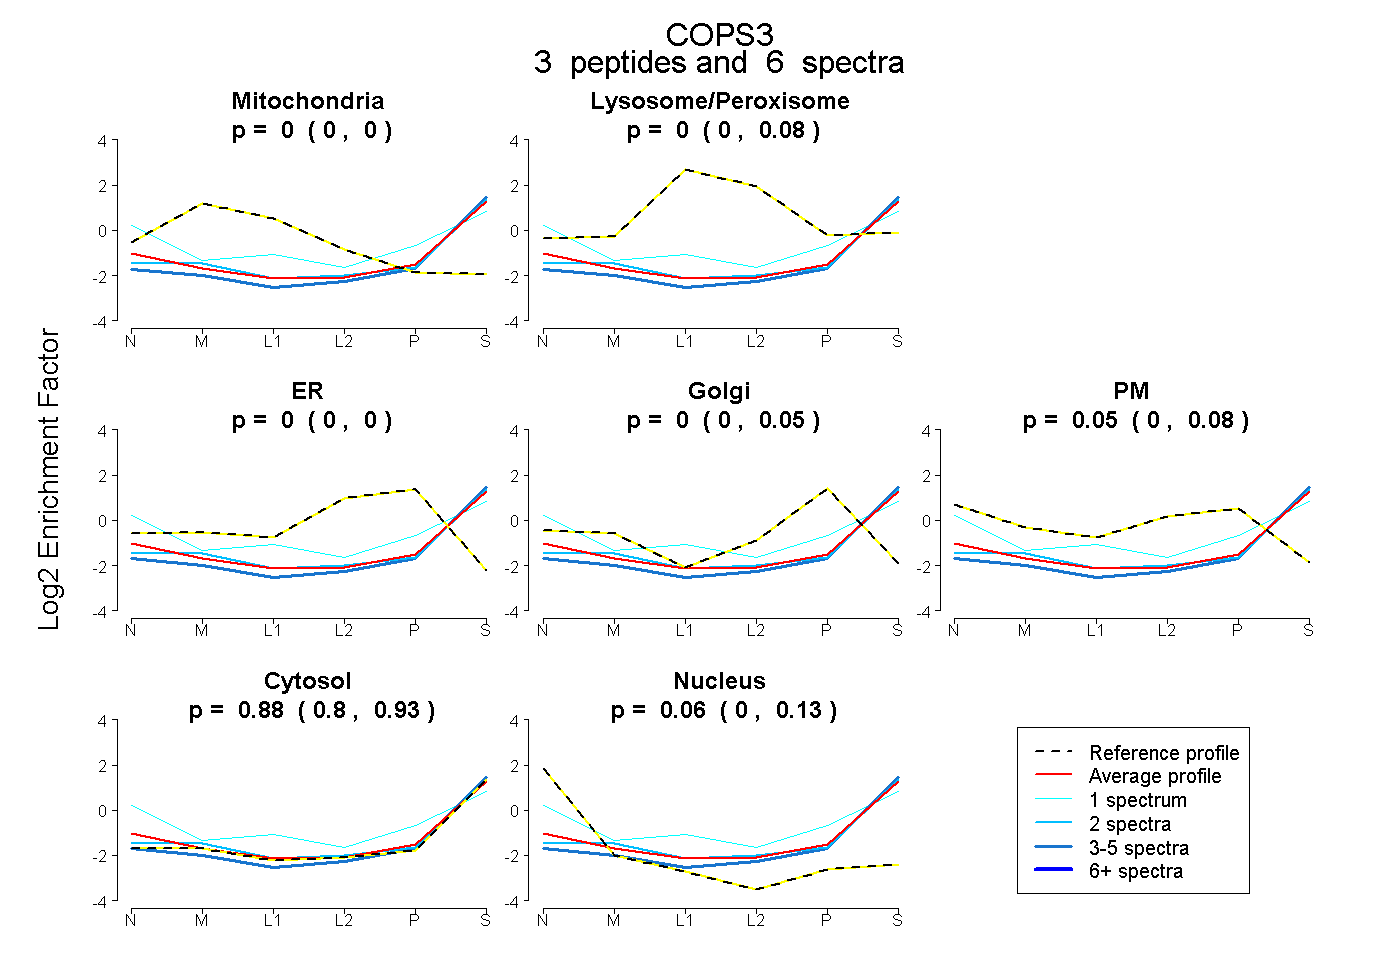 |
0.000 0.000 | 0.000 |
0.005 0.000 | 0.077 |
0.000 0.000 | 0.000 |
0.000 0.000 | 0.054 |
0.054 0.000 | 0.084 |
0.882 0.800 | 0.927 |
0.059 0.001 | 0.126 |
|||
| Plot | Lyso | Other | |||||||||||
| Expt C |
11 peptides |
32 spectra |
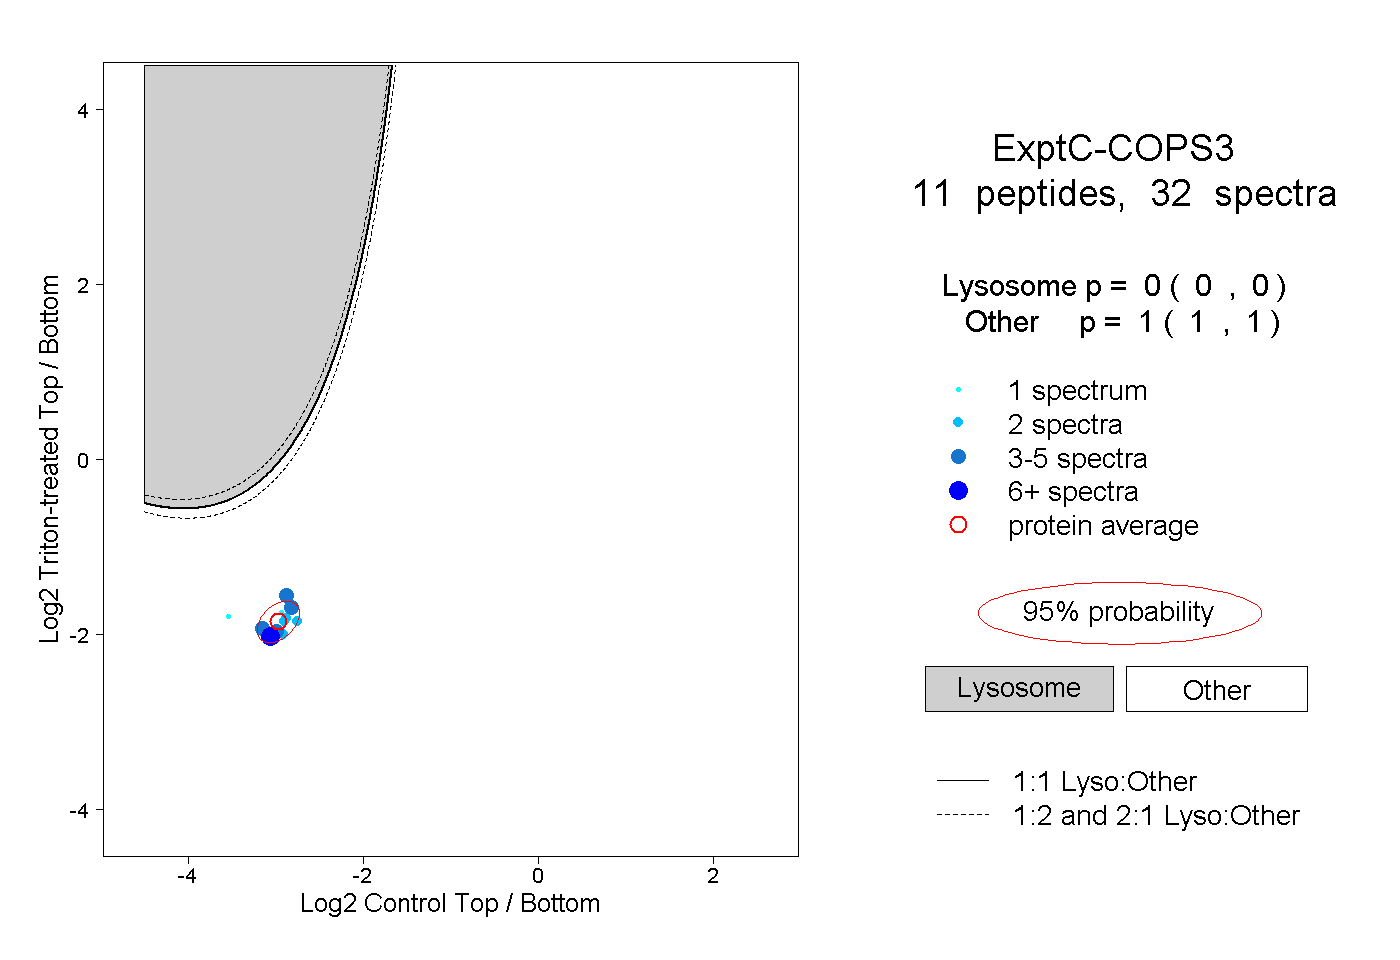 |
0.000 0.000 | 0.000 |
1.000 1.000 | 1.000 |
||||||||
| Plot | Lyso | Other | |||||||||||
| Expt D |
2 peptides |
2 spectra |
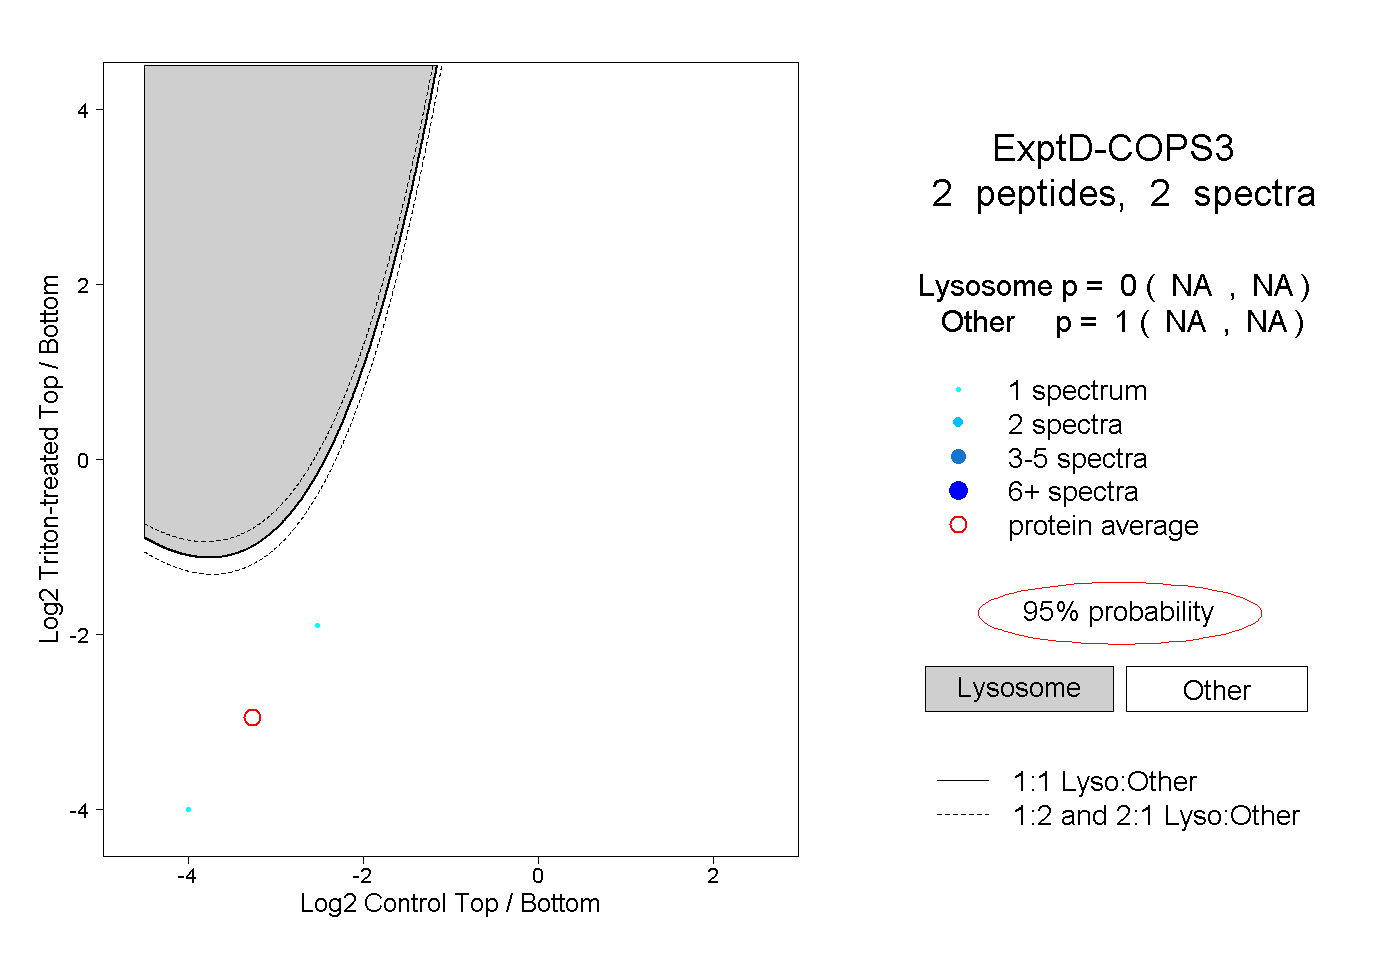 |
0.000 NA | NA |
1.000 NA | NA |