 5
5peptides
spectra
0.000 | 0.000
1.000 | 1.000
0.000 | 0.000
0.000 | 0.000
0.000 | 0.000
0.000 | 0.000
0.000 | 0.000
0.000 | 0.000
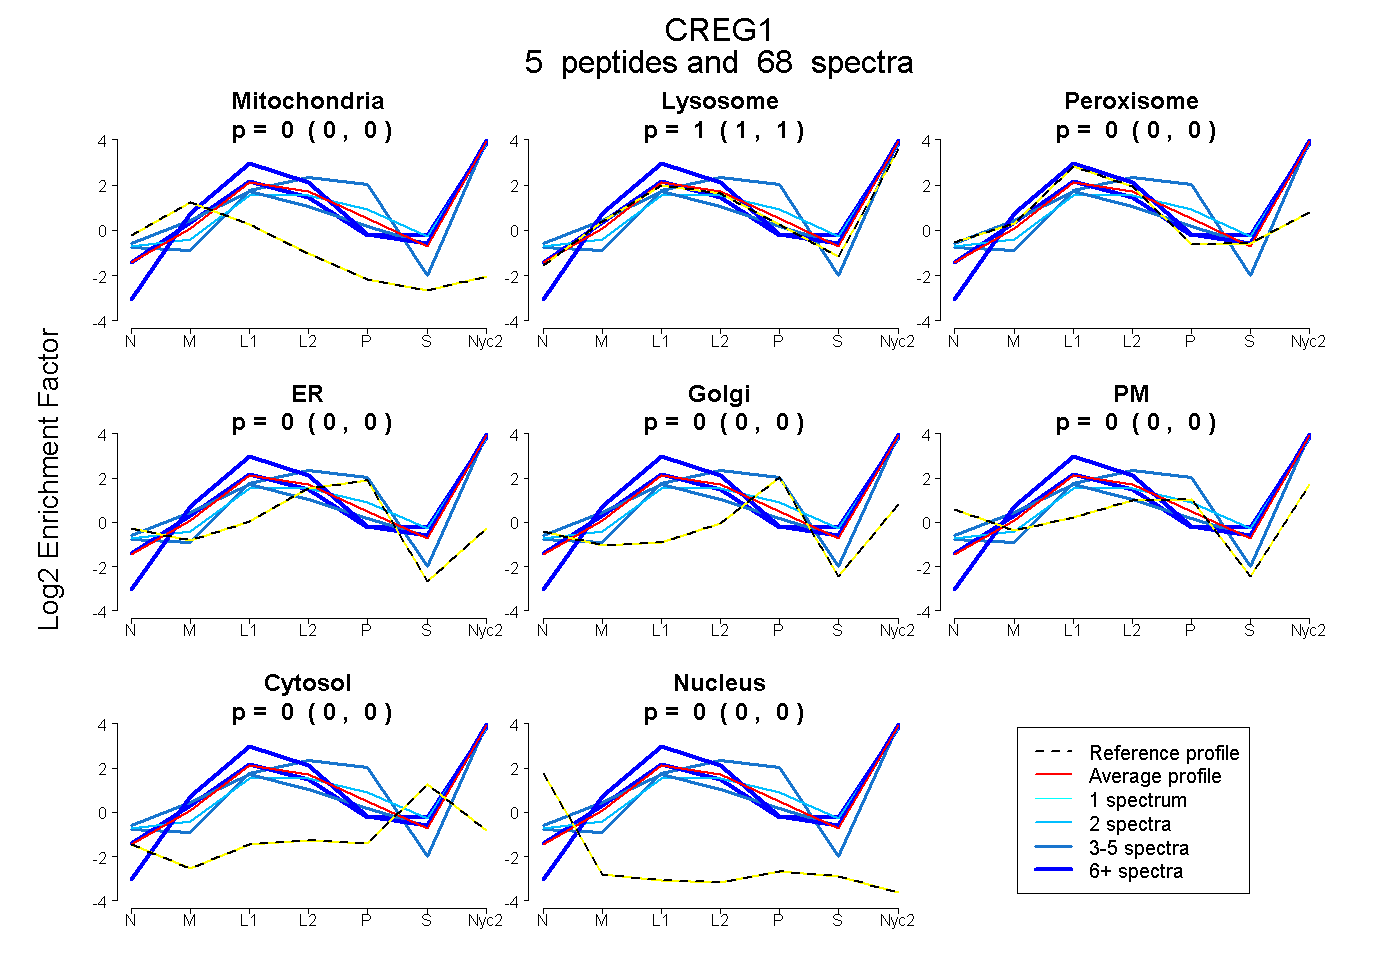
| Plot | Mito | Lyso | Perox | ER | Golgi | PM | Cytosol | Nucleus | |||||
| Expt A |
5 peptides |
68 spectra |
|
0.000 0.000 | 0.000 |
1.000 1.000 | 1.000 |
0.000 0.000 | 0.000 |
0.000 0.000 | 0.000 |
0.000 0.000 | 0.000 |
0.000 0.000 | 0.000 |
0.000 0.000 | 0.000 |
0.000 0.000 | 0.000 |
| 30 spectra, LPPLPPR | 0.000 | 1.000 | 0.000 | 0.000 | 0.000 | 0.000 | 0.000 | 0.000 | ||
| 4 spectra, DHGDWDVDR | 0.000 | 0.718 | 0.000 | 0.060 | 0.000 | 0.222 | 0.000 | 0.000 | ||
| 28 spectra, DSLFIR | 0.000 | 0.959 | 0.010 | 0.000 | 0.000 | 0.000 | 0.031 | 0.000 | ||
| 2 spectra, HWPPSHK | 0.000 | 0.854 | 0.000 | 0.000 | 0.000 | 0.092 | 0.054 | 0.000 | ||
| 4 spectra, ISNIWVLDYFGGPK | 0.000 | 0.911 | 0.000 | 0.000 | 0.000 | 0.067 | 0.022 | 0.000 |
| Plot | Mito | Lyso or Perox | ER | Golgi | PM | Cytosol | Nucleus | ||||||
| Expt B |
5 peptides |
25 spectra |
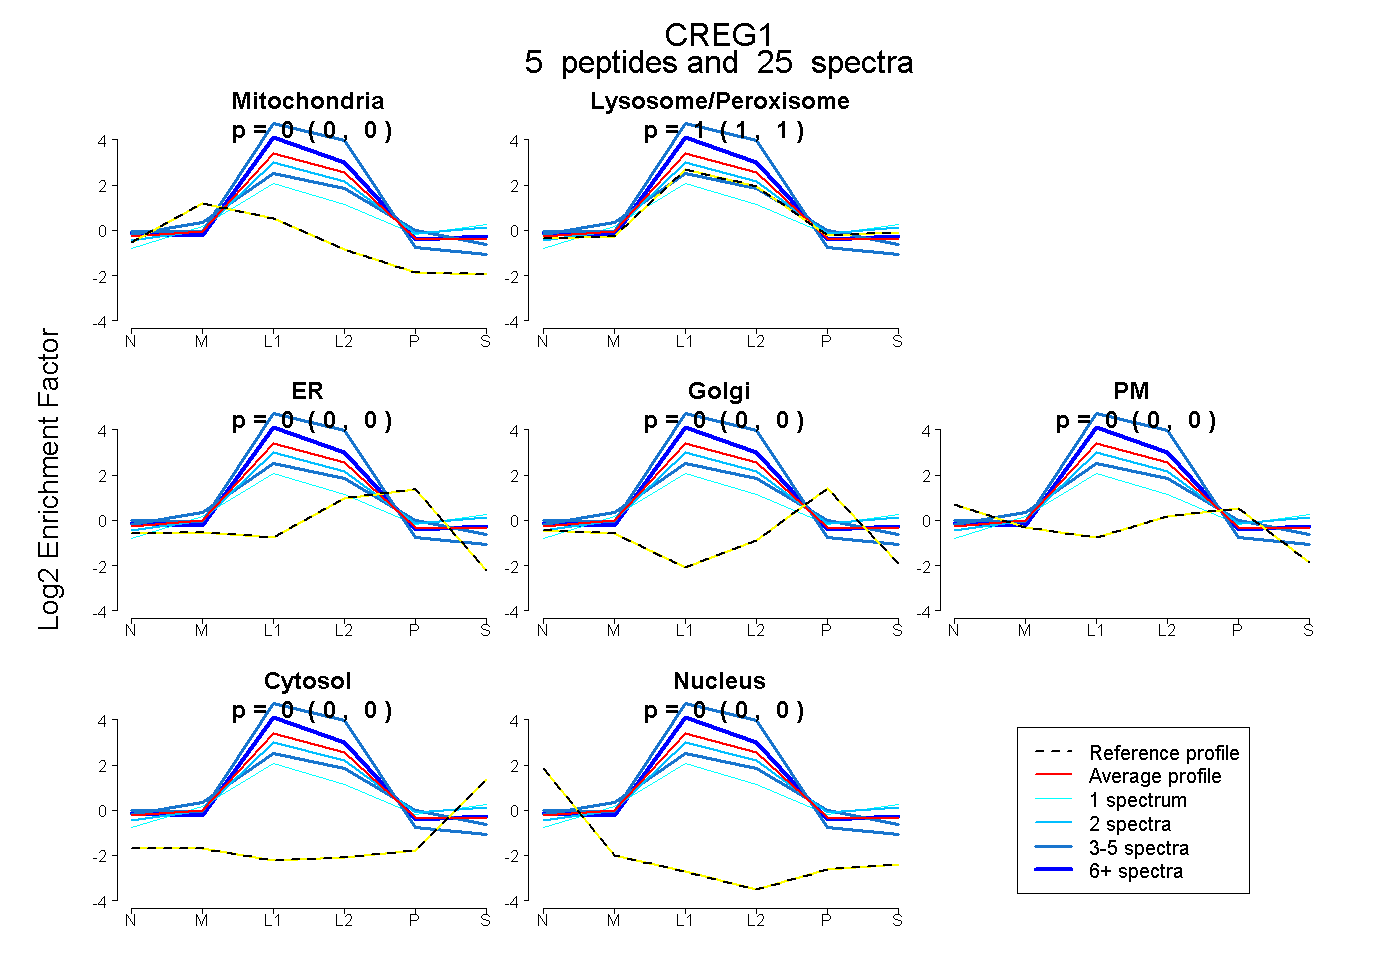 |
0.000 0.000 | 0.000 |
1.000 1.000 | 1.000 |
0.000 0.000 | 0.000 |
0.000 0.000 | 0.000 |
0.000 0.000 | 0.000 |
0.000 0.000 | 0.000 |
0.000 0.000 | 0.000 |
|||
| Plot | Lyso | Other | |||||||||||
| Expt C |
5 peptides |
108 spectra |
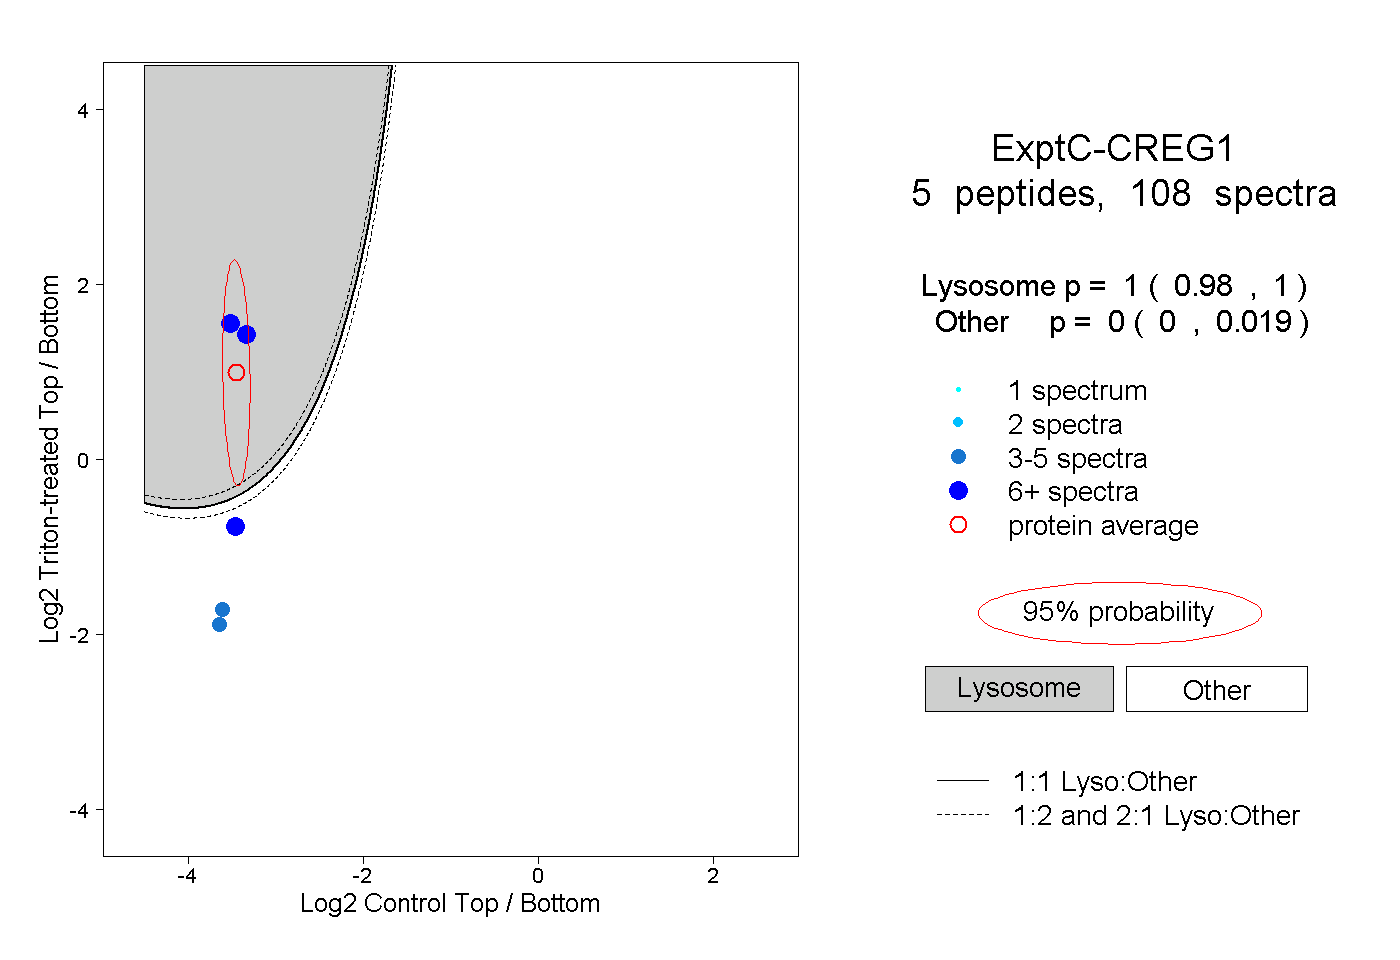 |
1.000 0.980 | 1.000 |
0.000 0.000 | 0.019 |
||||||||
| Plot | Lyso | Other | |||||||||||
| Expt D |
1 peptide |
18 spectra |
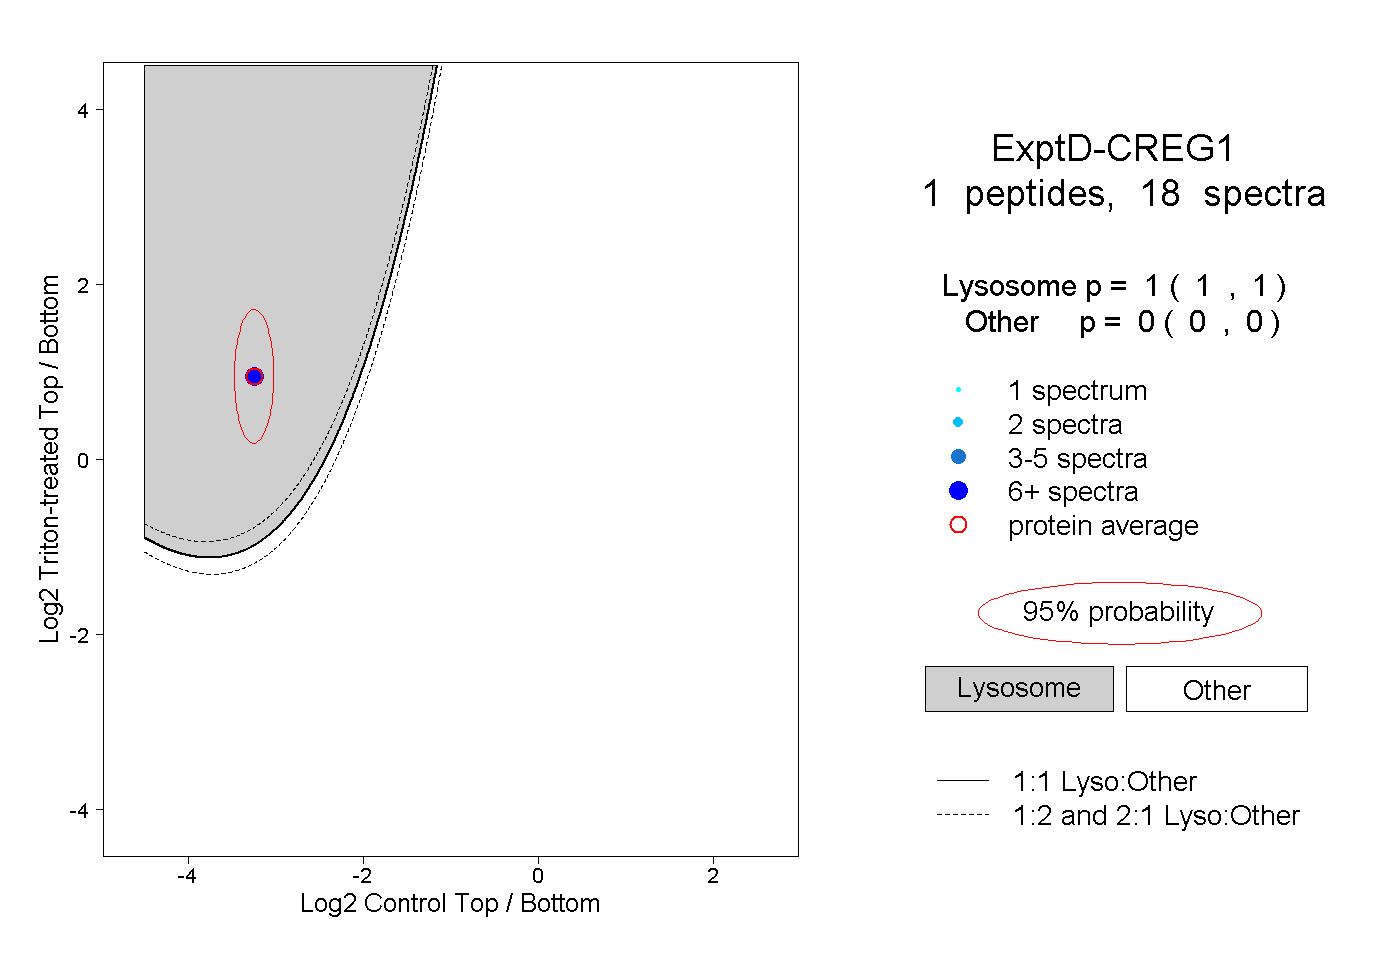 |
1.000 1.000 | 1.000 |
0.000 0.000 | 0.000 |