 2
2peptides
spectra
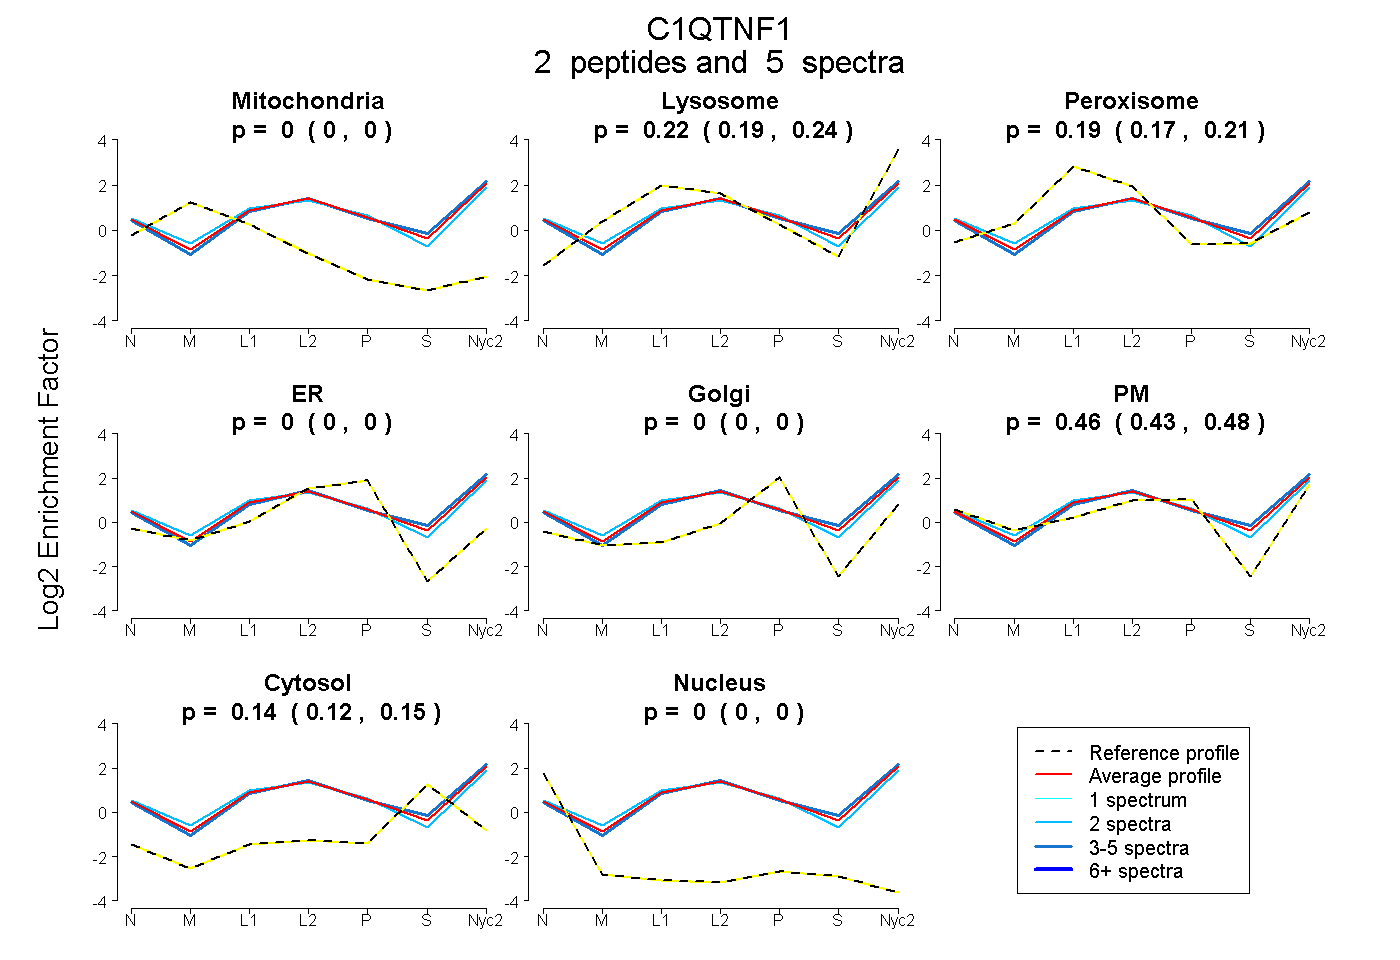
0.000 | 0.000
0.191 | 0.237
0.167 | 0.212
0.000 | 0.000
0.000 | 0.000
0.431 | 0.480
0.120 | 0.148
0.000 | 0.000
3peptides
spectra
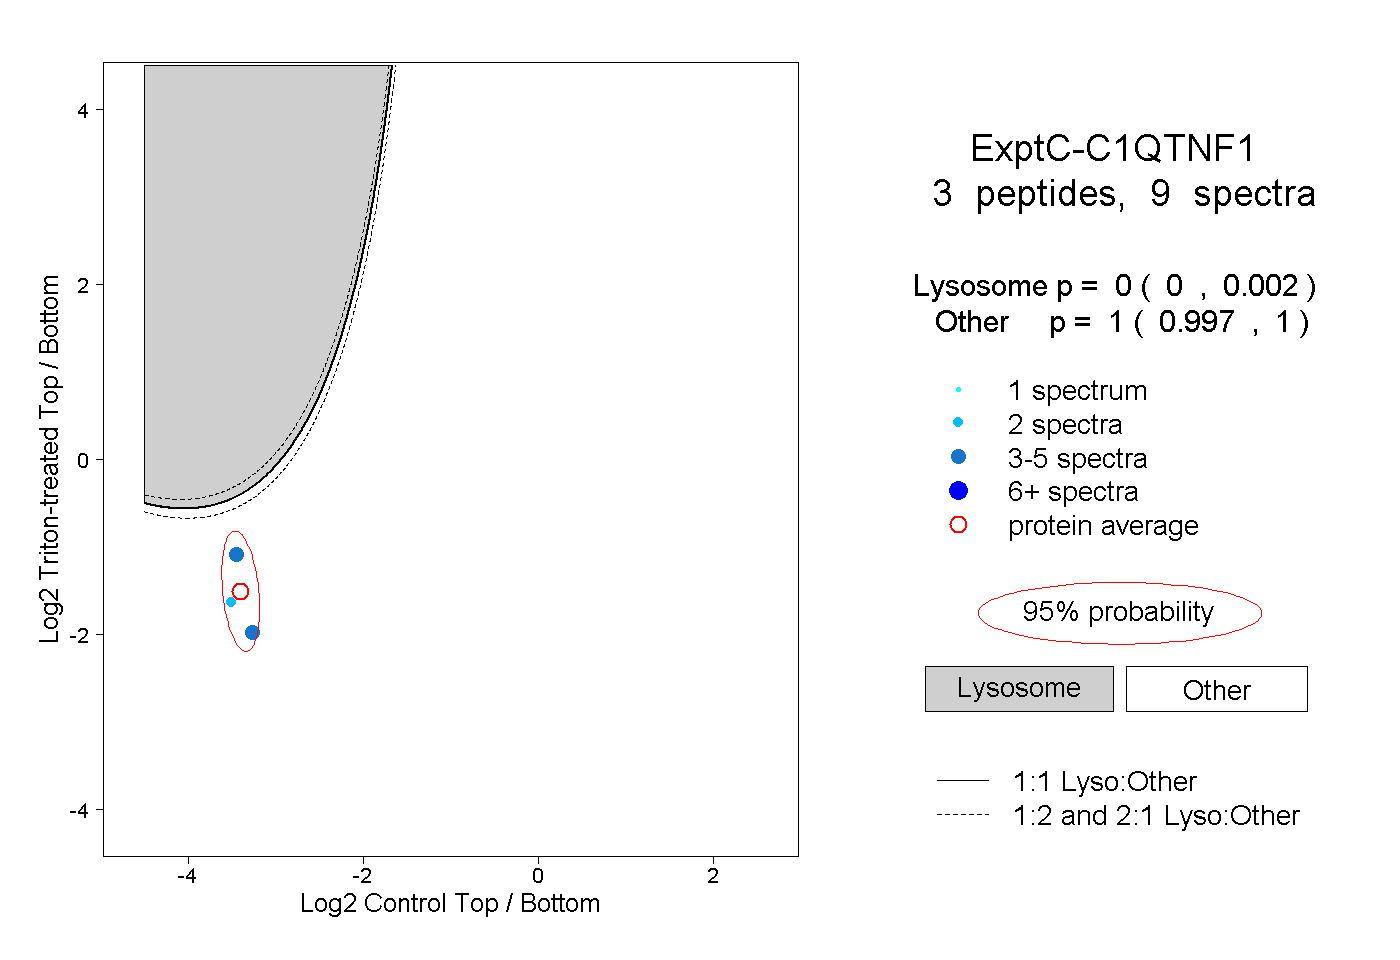
0.000 | 0.002
0.997 | 1.000
| Plot | Mito | Lyso | Perox | ER | Golgi | PM | Cytosol | Nucleus | |||||
| Expt A |
2 peptides |
5 spectra |
|
0.000 0.000 | 0.000 |
0.216 0.191 | 0.237 |
0.191 0.167 | 0.212 |
0.000 0.000 | 0.000 |
0.000 0.000 | 0.000 |
0.458 0.431 | 0.480 |
0.135 0.120 | 0.148 |
0.000 0.000 | 0.000 |
||
| Plot | Lyso | Other | |||||||||||
| Expt C |
3 peptides |
9 spectra |
|
0.000 0.000 | 0.002 |
1.000 0.997 | 1.000 |