 25
25peptides
spectra
0.000 | 0.000
0.000 | 0.000
0.252 | 0.257
0.041 | 0.051
0.000 | 0.000
0.344 | 0.354
0.347 | 0.351
0.000 | 0.000
| Plot | Mito | Lyso | Perox | ER | Golgi | PM | Cytosol | Nucleus | |||||
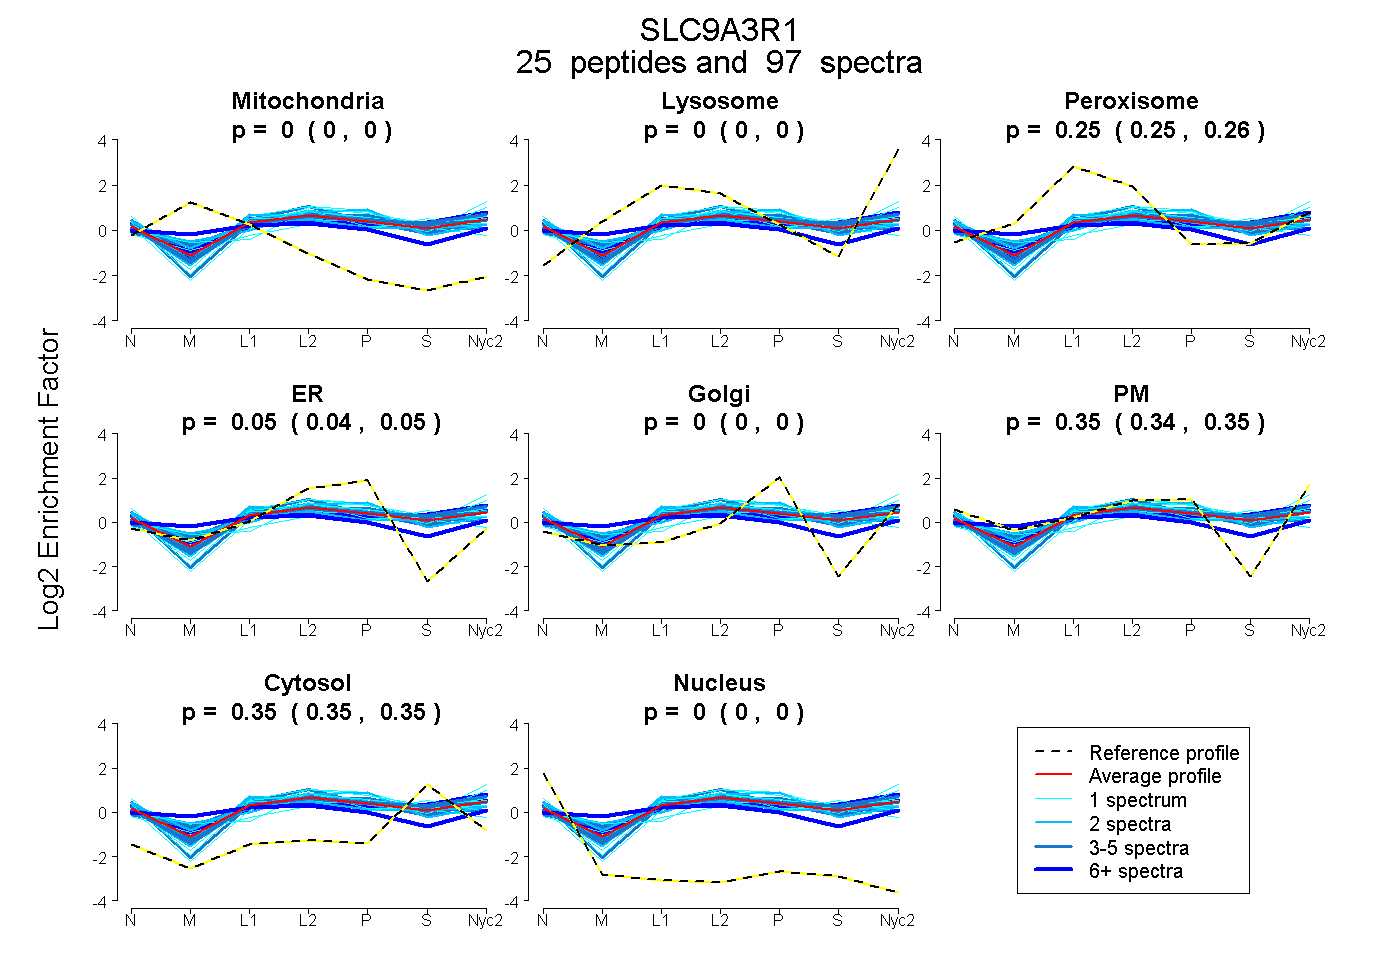
| Expt A |
25 peptides |
97 spectra |
|
0.000 0.000 | 0.000 |
0.000 0.000 | 0.000 |
0.255 0.252 | 0.257 |
0.046 0.041 | 0.051 |
0.000 0.000 | 0.000 |
0.350 0.344 | 0.354 |
0.349 0.347 | 0.351 |
0.000 0.000 | 0.000 |
| 1 spectrum, GPNGYGFNLHSDK | 0.000 | 0.000 | 0.200 | 0.000 | 0.000 | 0.476 | 0.324 | 0.000 | ||
| 23 spectra, VGQFIR | 0.125 | 0.000 | 0.239 | 0.031 | 0.052 | 0.297 | 0.256 | 0.000 | ||
| 4 spectra, EALVEPASESPRPALAR | 0.000 | 0.000 | 0.188 | 0.147 | 0.000 | 0.227 | 0.439 | 0.000 | ||
| 1 spectrum, LCCLEK | 0.000 | 0.000 | 0.271 | 0.397 | 0.000 | 0.000 | 0.332 | 0.000 | ||
| 2 spectra, LLVVDK | 0.000 | 0.000 | 0.278 | 0.000 | 0.000 | 0.388 | 0.334 | 0.000 | ||
| 1 spectrum, SADAAAGEPLPR | 0.000 | 0.000 | 0.222 | 0.076 | 0.000 | 0.318 | 0.384 | 0.000 | ||
| 1 spectrum, SEHTEPPAAADTK | 0.000 | 0.000 | 0.151 | 0.172 | 0.000 | 0.276 | 0.401 | 0.000 | ||
| 5 spectra, SGLLAGDR | 0.000 | 0.000 | 0.252 | 0.064 | 0.000 | 0.312 | 0.373 | 0.000 | ||
| 1 spectrum, LVEPGSPAEK | 0.000 | 0.000 | 0.233 | 0.054 | 0.000 | 0.350 | 0.363 | 0.000 | ||
| 3 spectra, AGGDEAK | 0.000 | 0.000 | 0.282 | 0.063 | 0.000 | 0.305 | 0.350 | 0.000 | ||
| 1 spectrum, APQMDWSK | 0.000 | 0.118 | 0.107 | 0.000 | 0.000 | 0.498 | 0.277 | 0.000 | ||
| 2 spectra, LVEVNGENVEK | 0.000 | 0.000 | 0.217 | 0.216 | 0.069 | 0.231 | 0.267 | 0.000 | ||
| 1 spectrum, CELRPR | 0.000 | 0.000 | 0.235 | 0.040 | 0.000 | 0.425 | 0.301 | 0.000 | ||
| 5 spectra, AGDQNEAEK | 0.000 | 0.000 | 0.294 | 0.000 | 0.000 | 0.416 | 0.290 | 0.000 | ||
| 2 spectra, LGVPIR | 0.000 | 0.000 | 0.252 | 0.094 | 0.000 | 0.285 | 0.369 | 0.000 | ||
| 5 spectra, AVDPDSPAEASGLR | 0.000 | 0.000 | 0.257 | 0.000 | 0.000 | 0.408 | 0.335 | 0.000 | ||
| 3 spectra, ETHQQVVSR | 0.000 | 0.000 | 0.271 | 0.000 | 0.000 | 0.378 | 0.351 | 0.000 | ||
| 5 spectra, LCTMK | 0.000 | 0.000 | 0.324 | 0.177 | 0.097 | 0.087 | 0.316 | 0.000 | ||
| 2 spectra, LLVVDPETDEQLK | 0.000 | 0.000 | 0.303 | 0.085 | 0.000 | 0.273 | 0.340 | 0.000 | ||
| 13 spectra, AALNAVR | 0.000 | 0.000 | 0.280 | 0.038 | 0.000 | 0.347 | 0.335 | 0.000 | ||
| 4 spectra, SKPGQFIR | 0.000 | 0.000 | 0.244 | 0.000 | 0.000 | 0.373 | 0.384 | 0.000 | ||
| 3 spectra, IVEVNGVCMEGK | 0.000 | 0.000 | 0.253 | 0.063 | 0.000 | 0.376 | 0.307 | 0.000 | ||
| 6 spectra, ETDEFFK | 0.000 | 0.040 | 0.234 | 0.000 | 0.000 | 0.340 | 0.387 | 0.000 | ||
| 1 spectrum, QHGDVVSAIK | 0.000 | 0.000 | 0.225 | 0.057 | 0.000 | 0.230 | 0.488 | 0.000 | ||
| 2 spectra, GPNGYGFHLHGEK | 0.000 | 0.000 | 0.282 | 0.000 | 0.015 | 0.359 | 0.344 | 0.000 |
| Plot | Mito | Lyso or Perox | ER | Golgi | PM | Cytosol | Nucleus | ||||||
| Expt B |
10 peptides |
38 spectra |
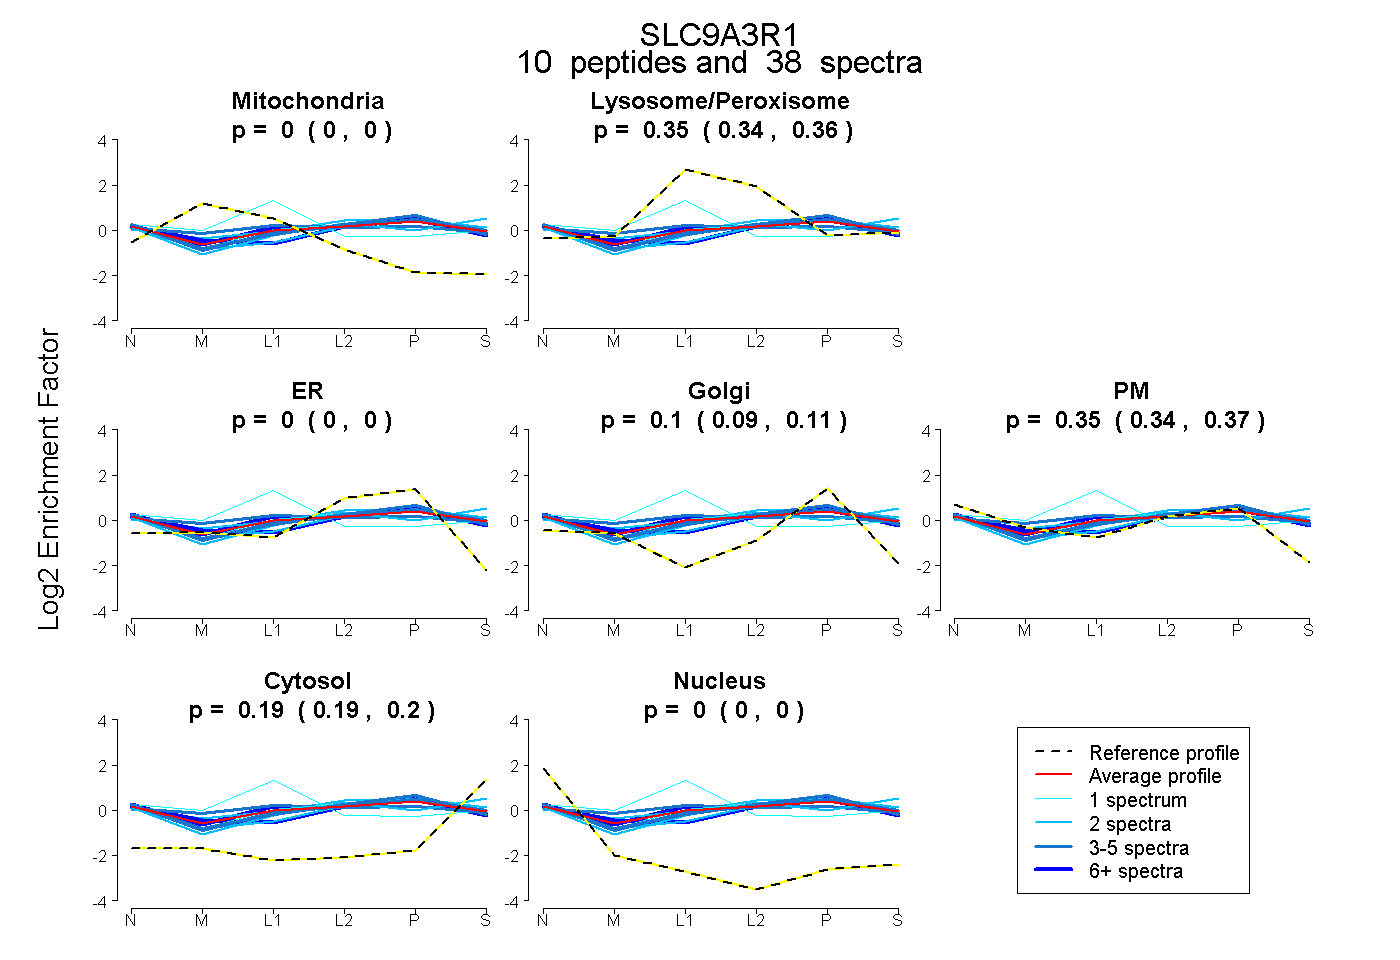 |
0.000 0.000 | 0.000 |
0.350 0.339 | 0.358 |
0.000 0.000 | 0.000 |
0.102 0.088 | 0.114 |
0.354 0.339 | 0.367 |
0.194 0.188 | 0.199 |
0.000 0.000 | 0.000 |
|||
| Plot | Lyso | Other | |||||||||||
| Expt C |
25 peptides |
253 spectra |
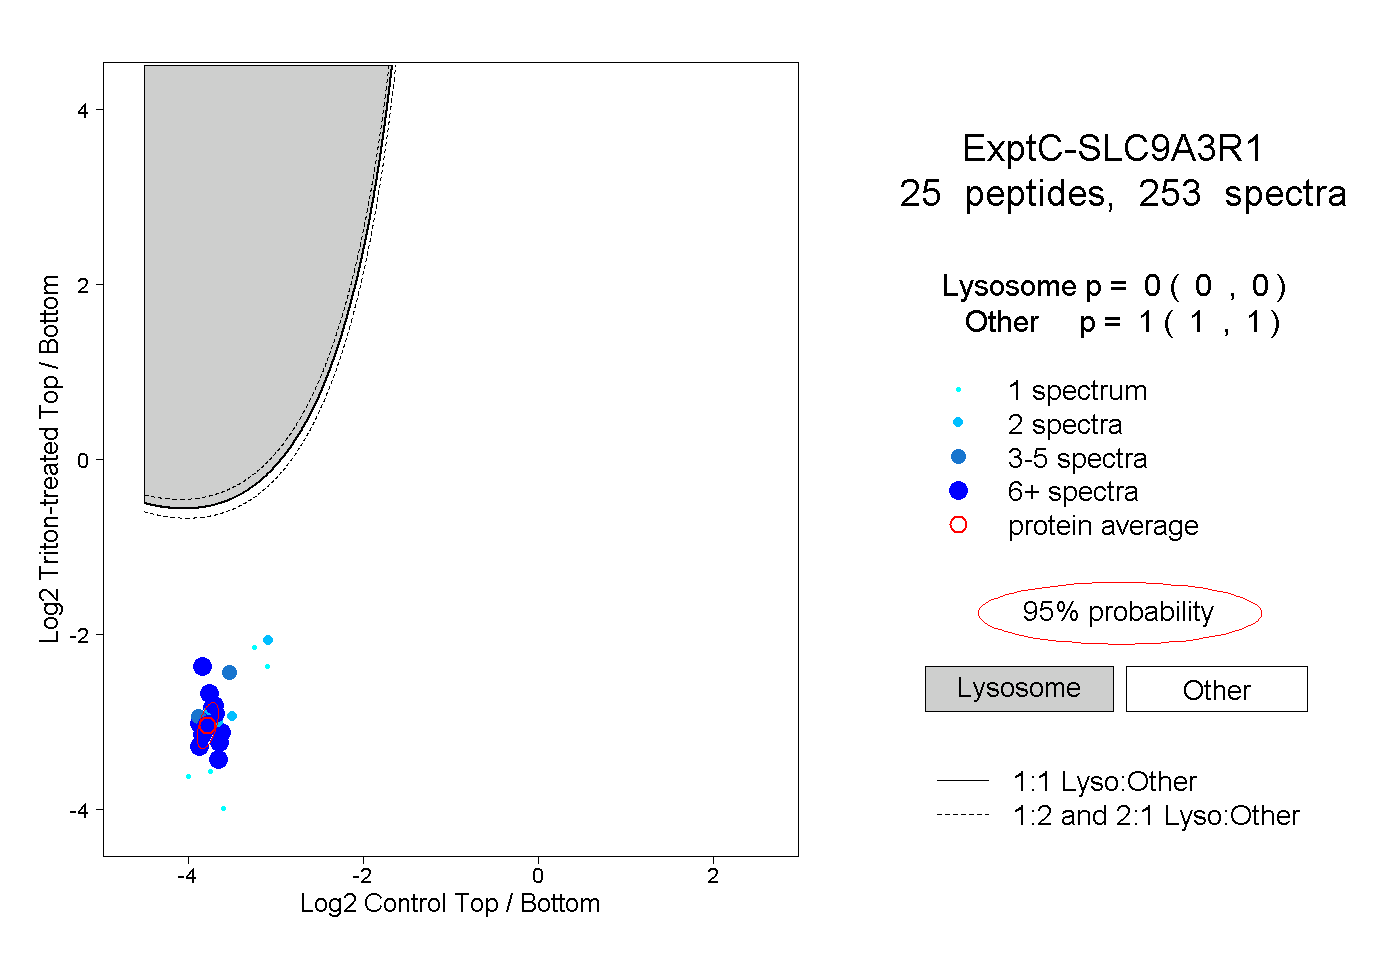 |
0.000 0.000 | 0.000 |
1.000 1.000 | 1.000 |
||||||||
| Plot | Lyso | Other | |||||||||||
| Expt D |
10 peptides |
33 spectra |
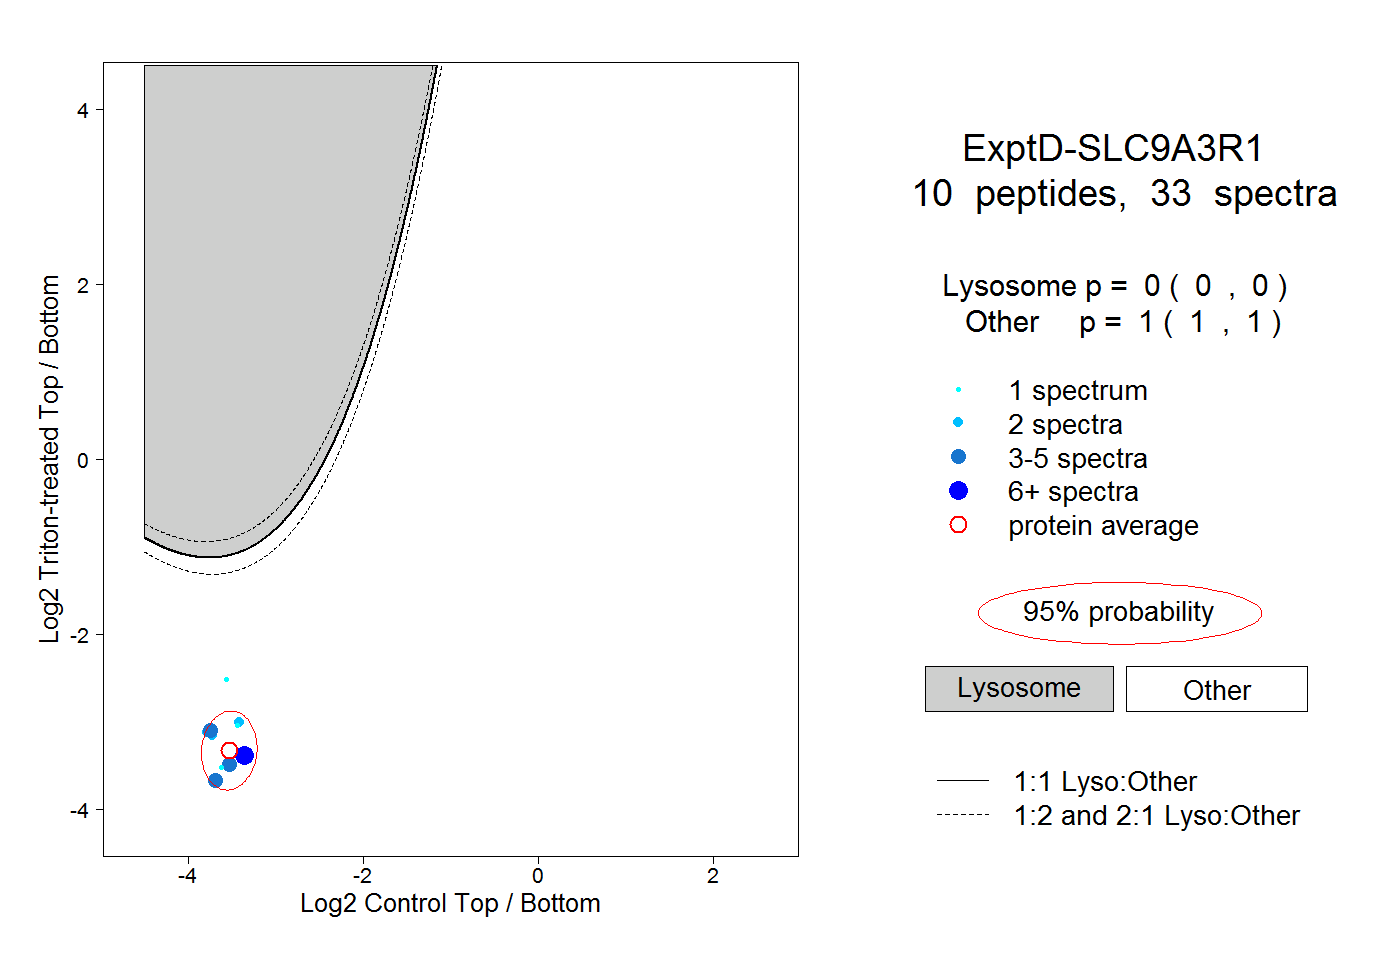 |
0.000 0.000 | 0.000 |
1.000 1.000 | 1.000 |