 3
3peptides
spectra
0.000 | 0.000
0.000 | 0.000
0.000 | 0.000
0.002 | 0.257
0.000 | 0.197
0.000 | 0.095
0.590 | 0.672
0.077 | 0.146
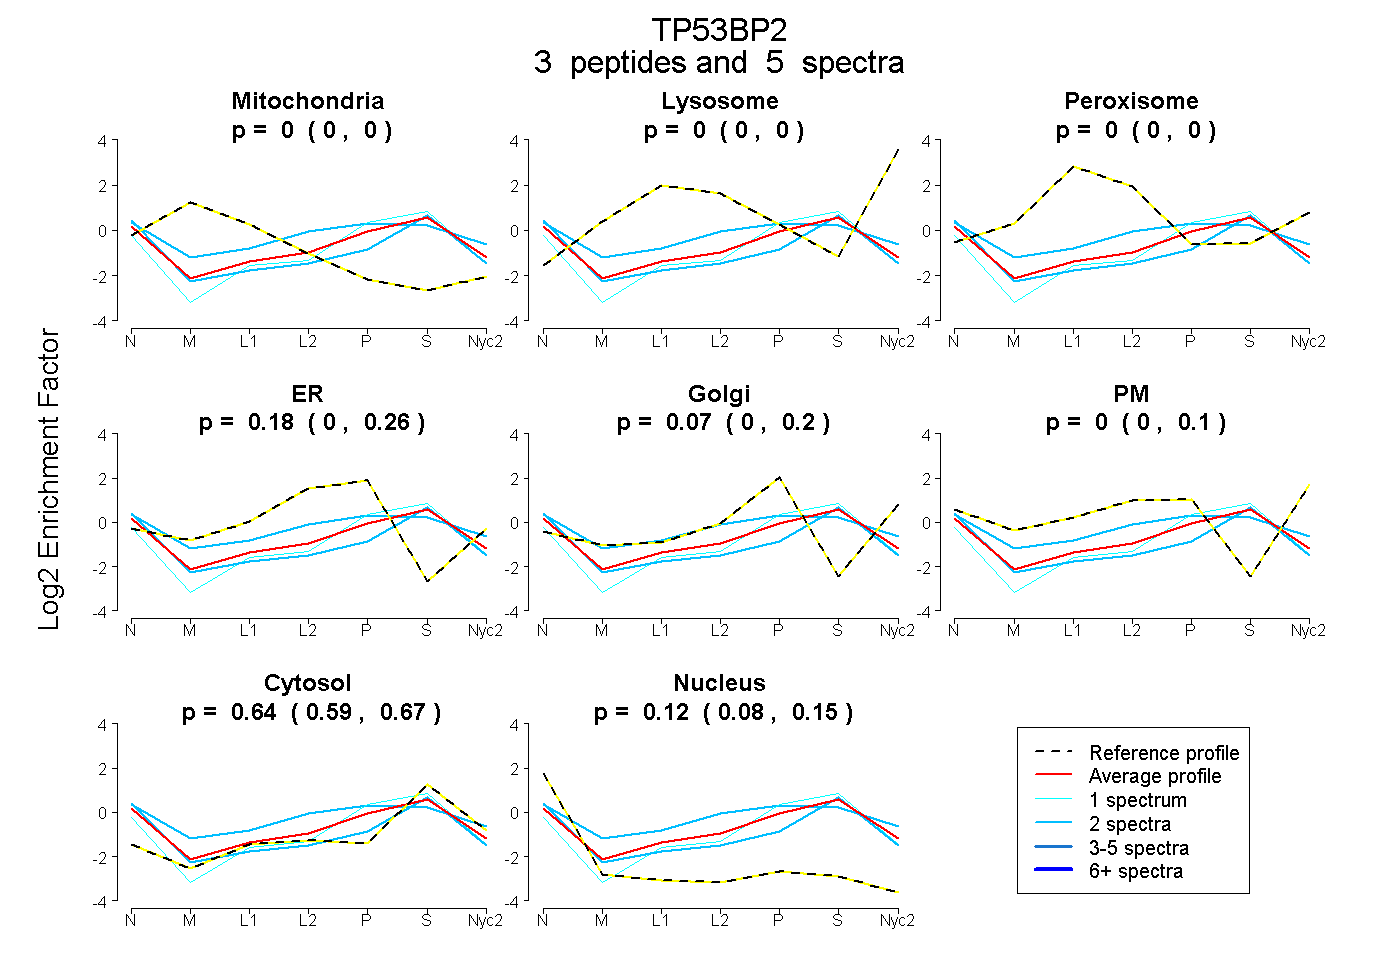
| Plot | Mito | Lyso | Perox | ER | Golgi | PM | Cytosol | Nucleus | |||||
| Expt A |
3 peptides |
5 spectra |
|
0.000 0.000 | 0.000 |
0.000 0.000 | 0.000 |
0.000 0.000 | 0.000 |
0.177 0.002 | 0.257 |
0.069 0.000 | 0.197 |
0.001 0.000 | 0.095 |
0.638 0.590 | 0.672 |
0.116 0.077 | 0.146 |