 4
4peptides
spectra
0.000 | 0.000
0.000 | 0.000
0.000 | 0.000
0.000 | 0.084
0.840 | 0.993
0.000 | 0.062
0.000 | 0.022
0.000 | 0.050
| Plot | Mito | Lyso | Perox | ER | Golgi | PM | Cytosol | Nucleus | |||||
| Expt A |
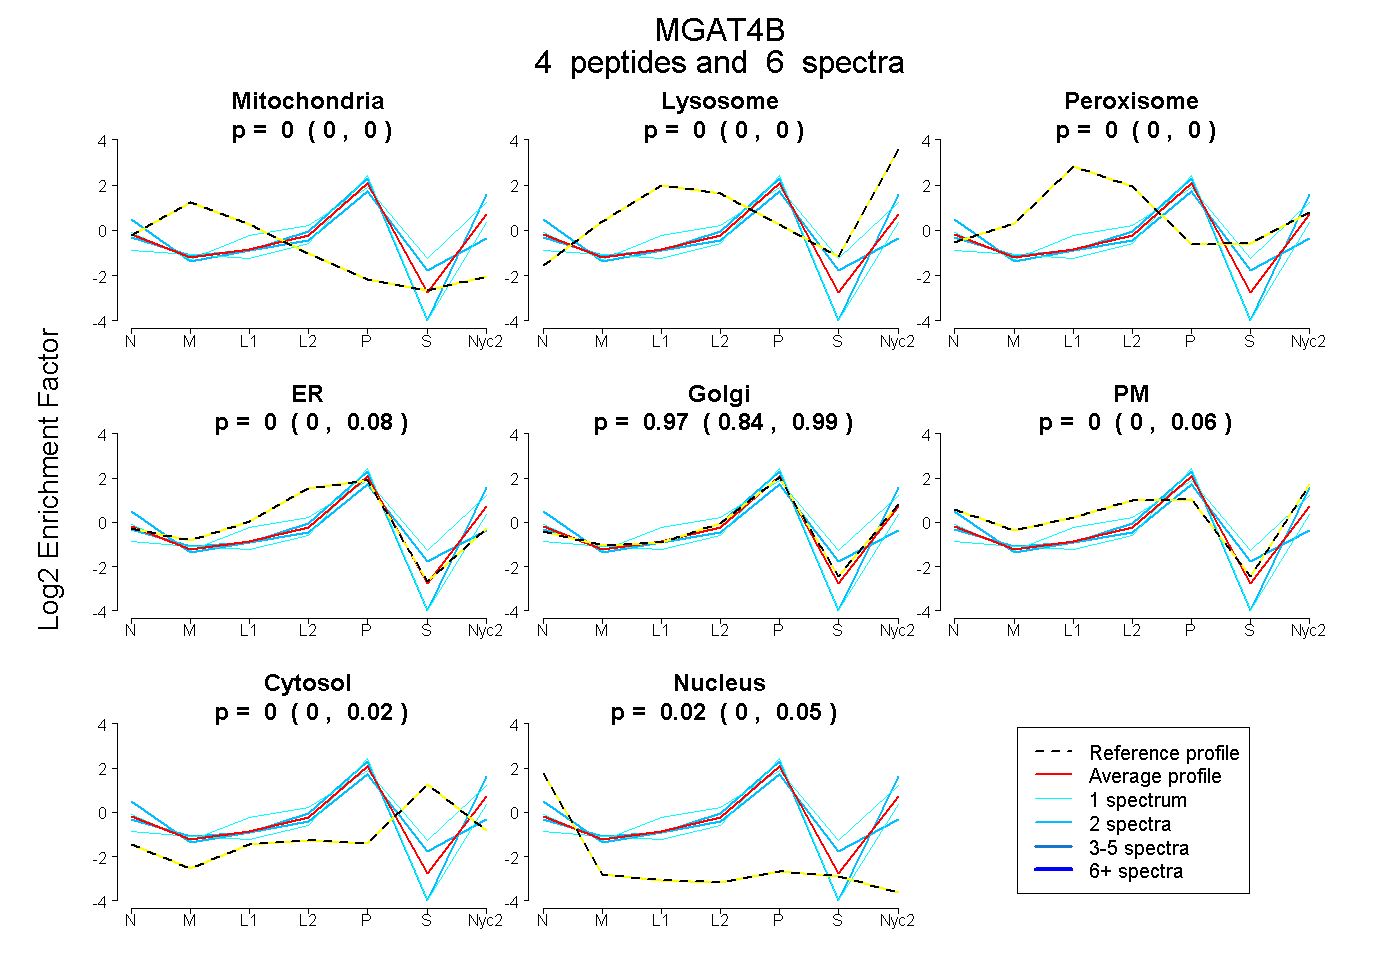
4 peptides |
6 spectra |
|
0.000 0.000 | 0.000 |
0.000 0.000 | 0.000 |
0.000 0.000 | 0.000 |
0.001 0.000 | 0.084 |
0.975 0.840 | 0.993 |
0.000 0.000 | 0.062 |
0.000 0.000 | 0.022 |
0.024 0.000 | 0.050 |
| 2 spectra, FFQPLR | 0.000 | 0.000 | 0.000 | 0.000 | 0.894 | 0.106 | 0.000 | 0.000 | ||
| 1 spectrum, GVAEGEVDPAFGPLEALR | 0.000 | 0.000 | 0.000 | 0.000 | 0.961 | 0.000 | 0.000 | 0.039 | ||
| 1 spectrum, SGNIEHPEDK | 0.000 | 0.105 | 0.011 | 0.000 | 0.624 | 0.154 | 0.106 | 0.000 | ||
| 2 spectra, EALQEGR | 0.000 | 0.000 | 0.000 | 0.184 | 0.617 | 0.000 | 0.064 | 0.136 |
| Plot | Lyso | Other | |||||||||||
| Expt C |
3 peptides |
5 spectra |
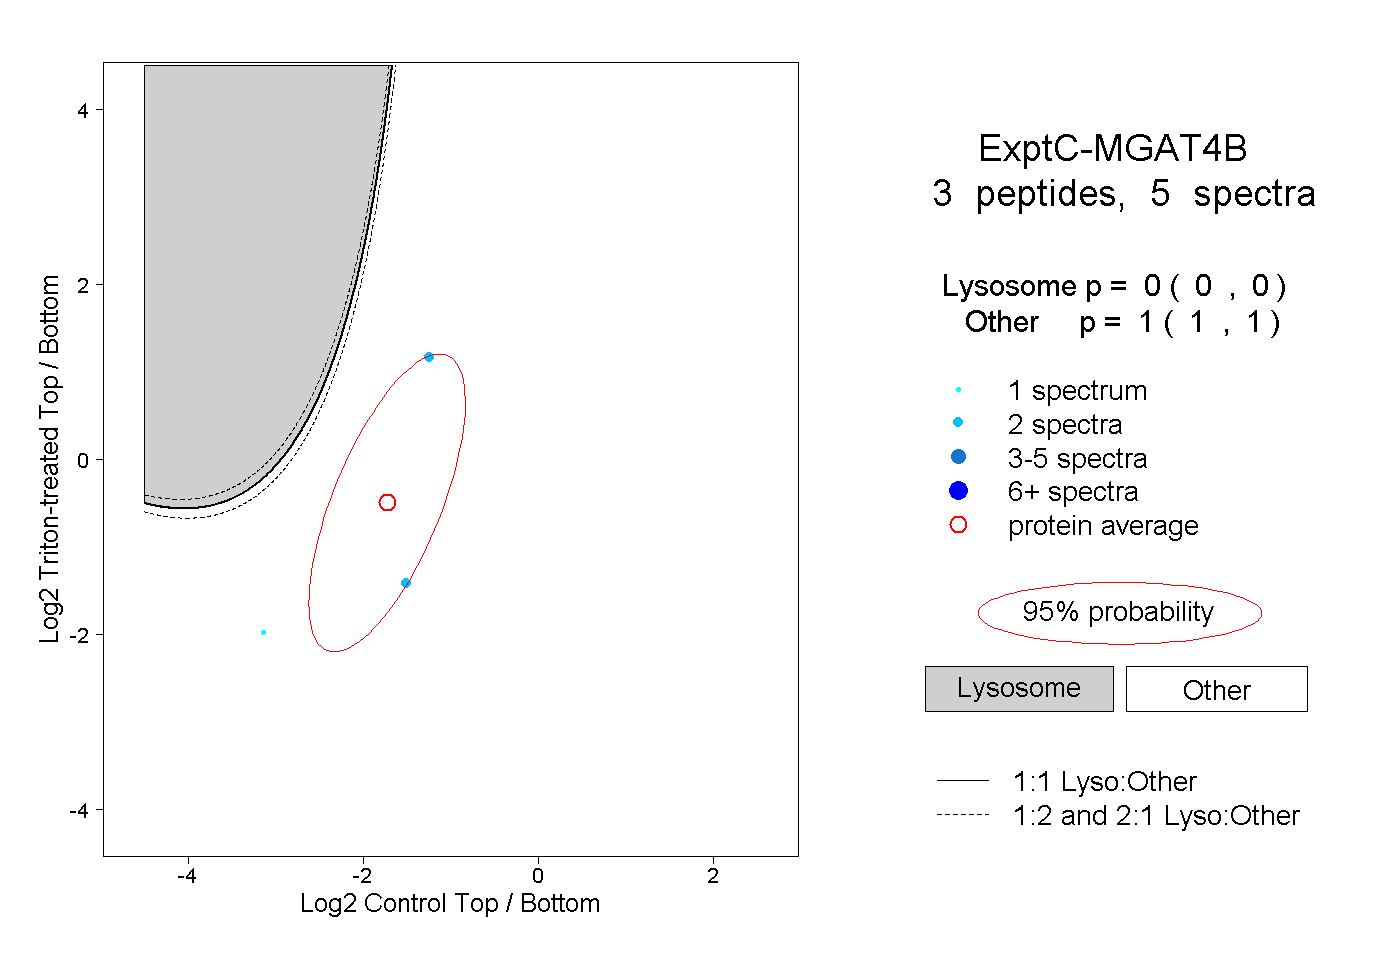 |
0.000 0.000 | 0.000 |
1.000 1.000 | 1.000 |