 10
10peptides
spectra
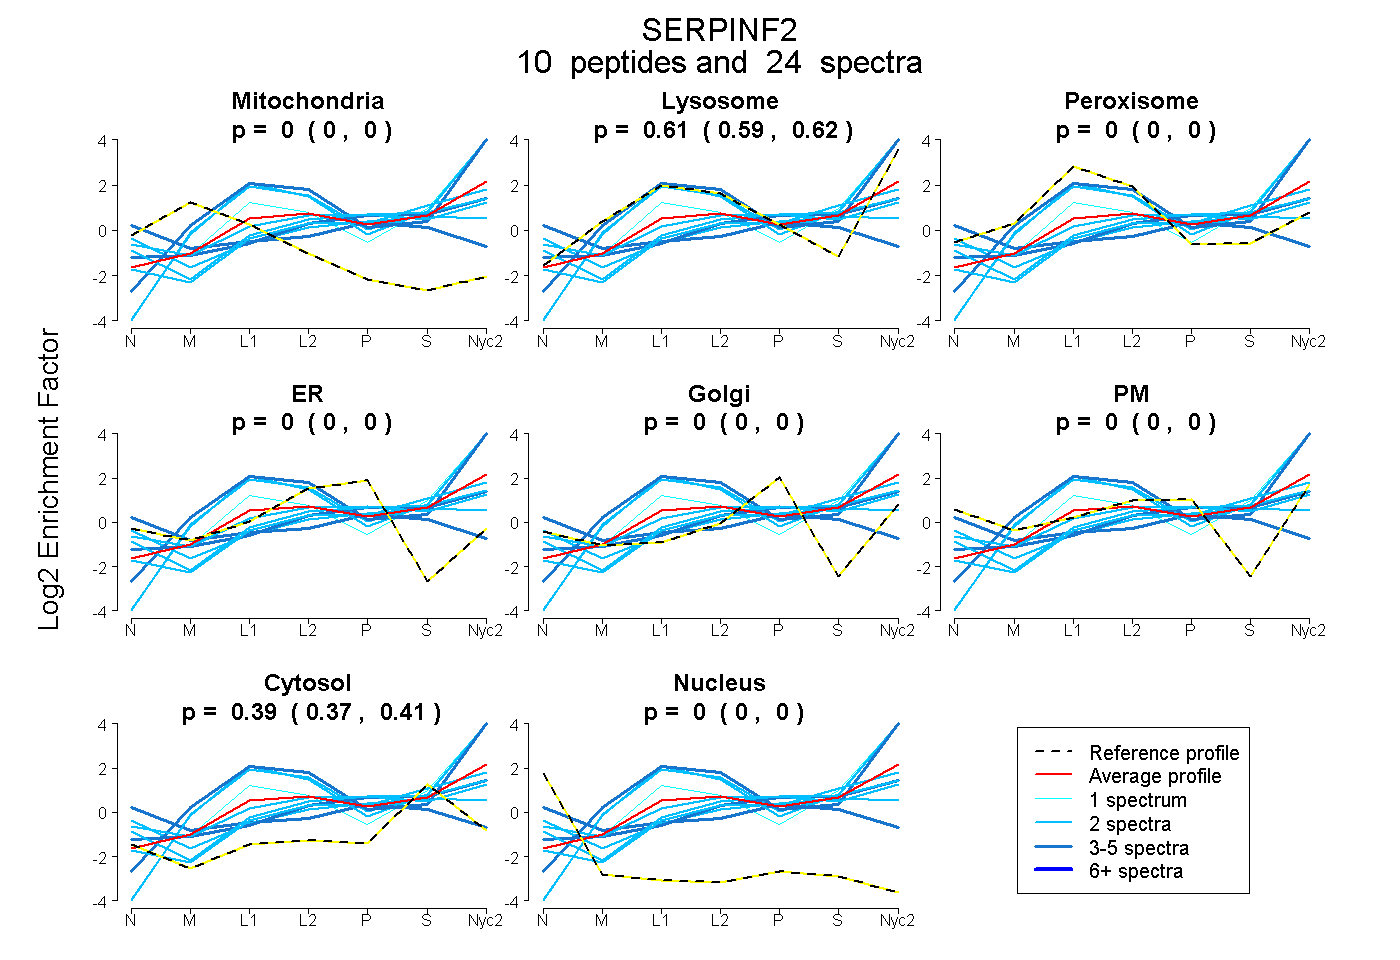
0.000 | 0.000
0.589 | 0.623
0.000 | 0.000
0.000 | 0.000
0.000 | 0.000
0.000 | 0.000
0.373 | 0.407
0.000 | 0.000
4peptides
spectra
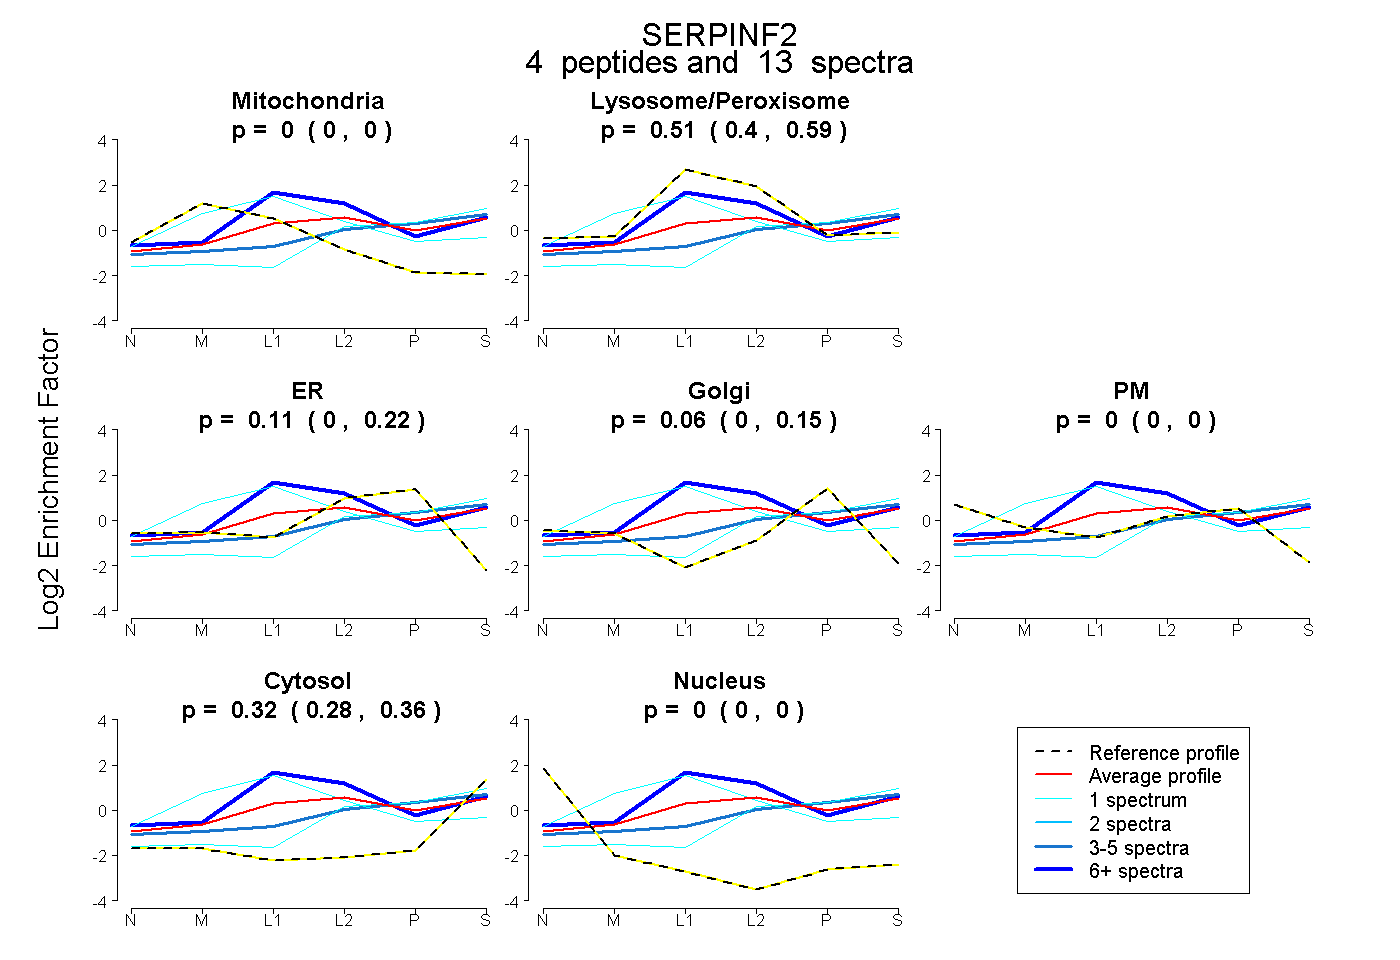
0.000 | 0.000
0.399 | 0.590
0.000 | 0.224
0.000 | 0.153
0.000 | 0.000
0.275 | 0.364
0.000 | 0.000
12peptides
spectra
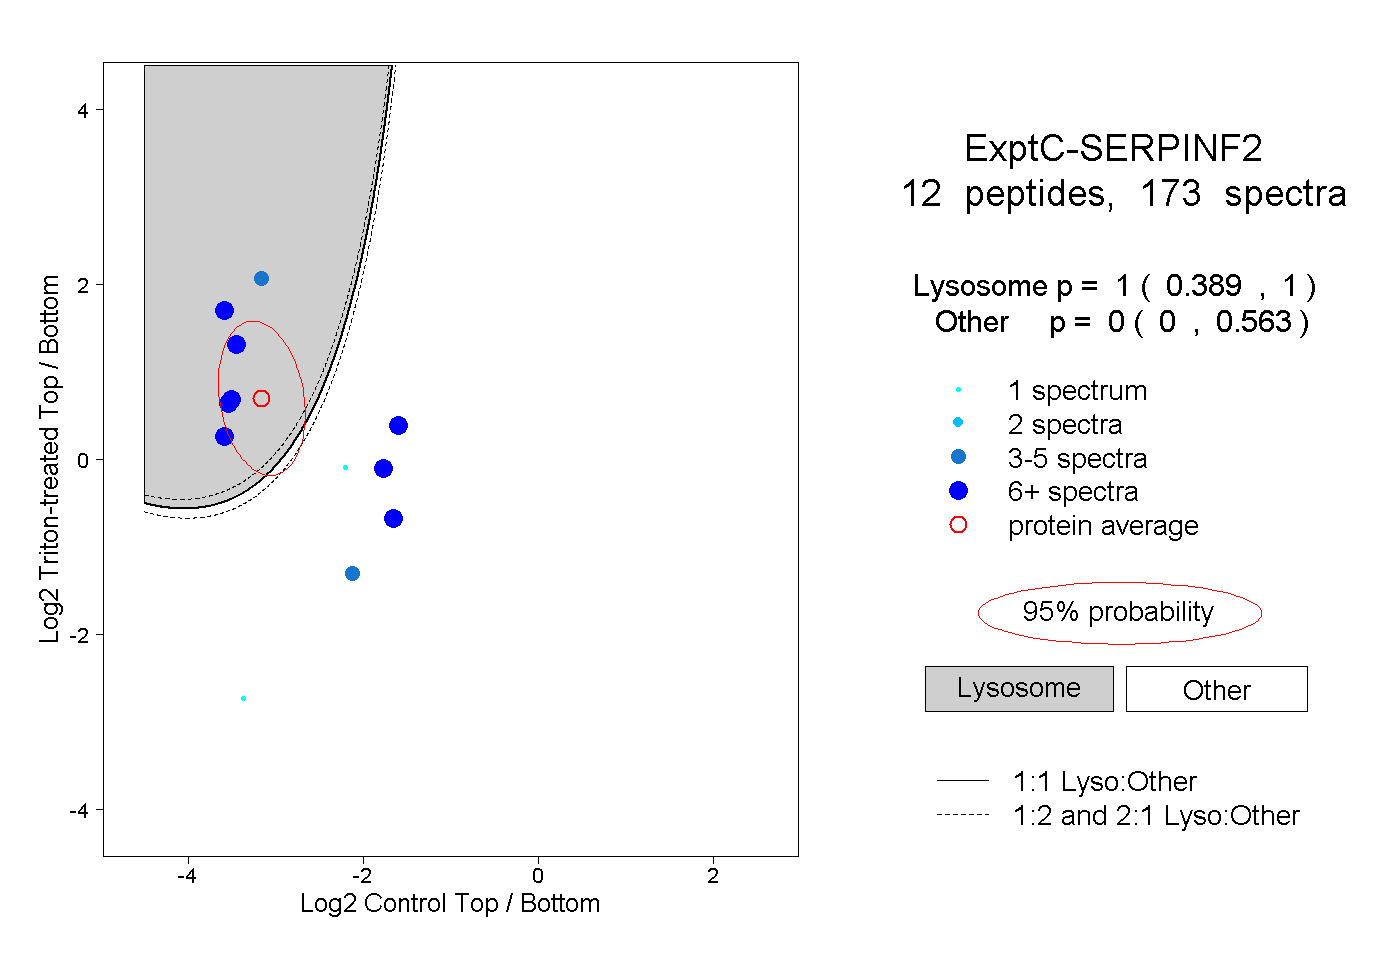
0.389 | 1.000
0.000 | 0.563
10peptides
spectra
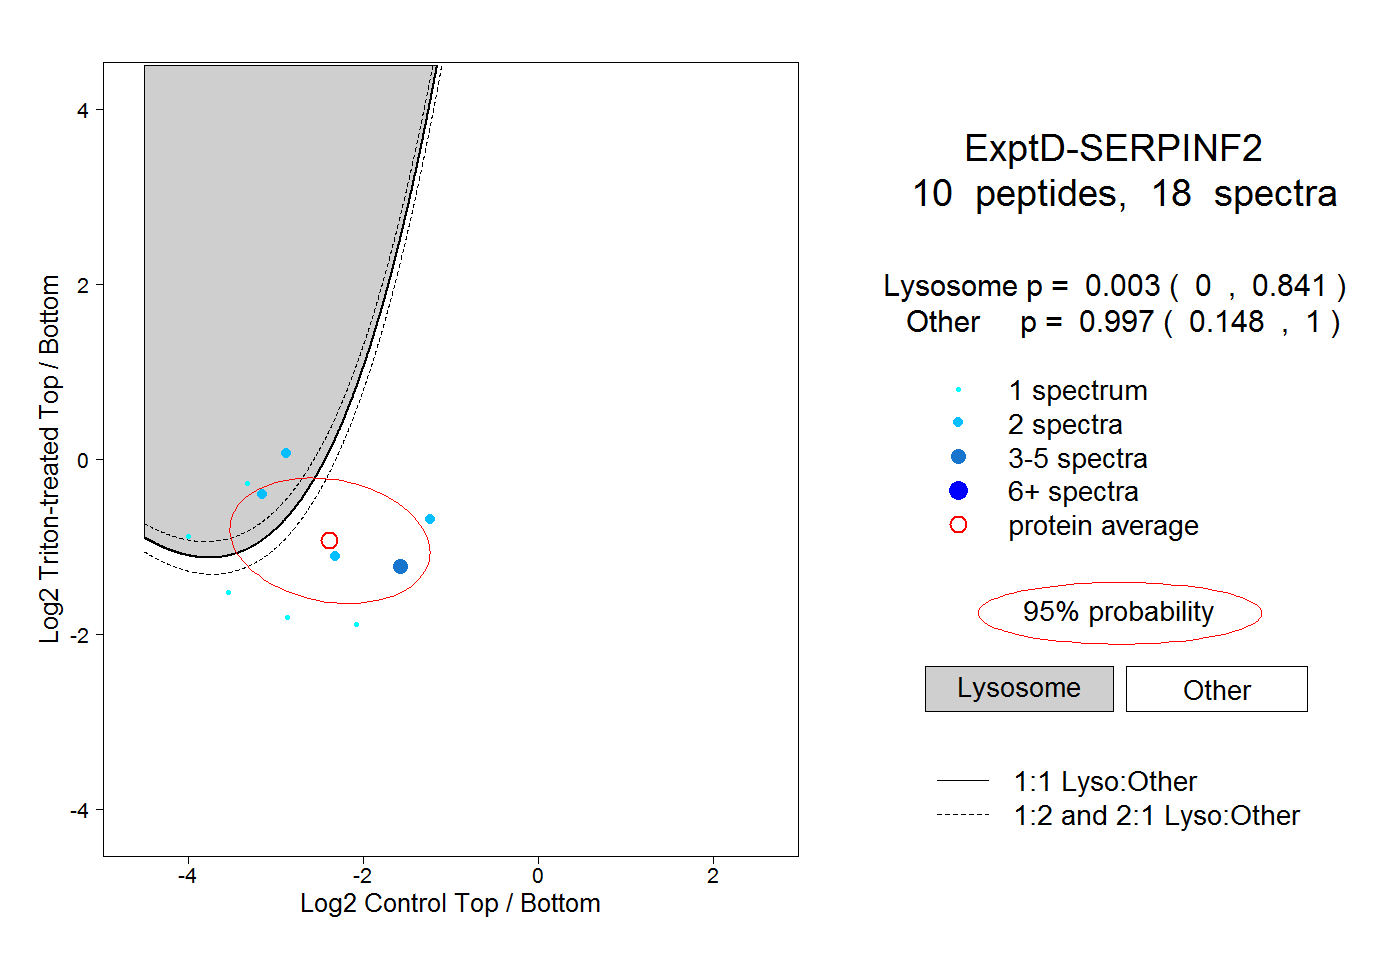
0.000 | 0.841
0.148 | 1.000