 10
10peptides
spectra
0.000 | 0.000
0.589 | 0.623
0.000 | 0.000
0.000 | 0.000
0.000 | 0.000
0.000 | 0.000
0.373 | 0.407
0.000 | 0.000
| Plot | Mito | Lyso | Perox | ER | Golgi | PM | Cytosol | Nucleus | |||||
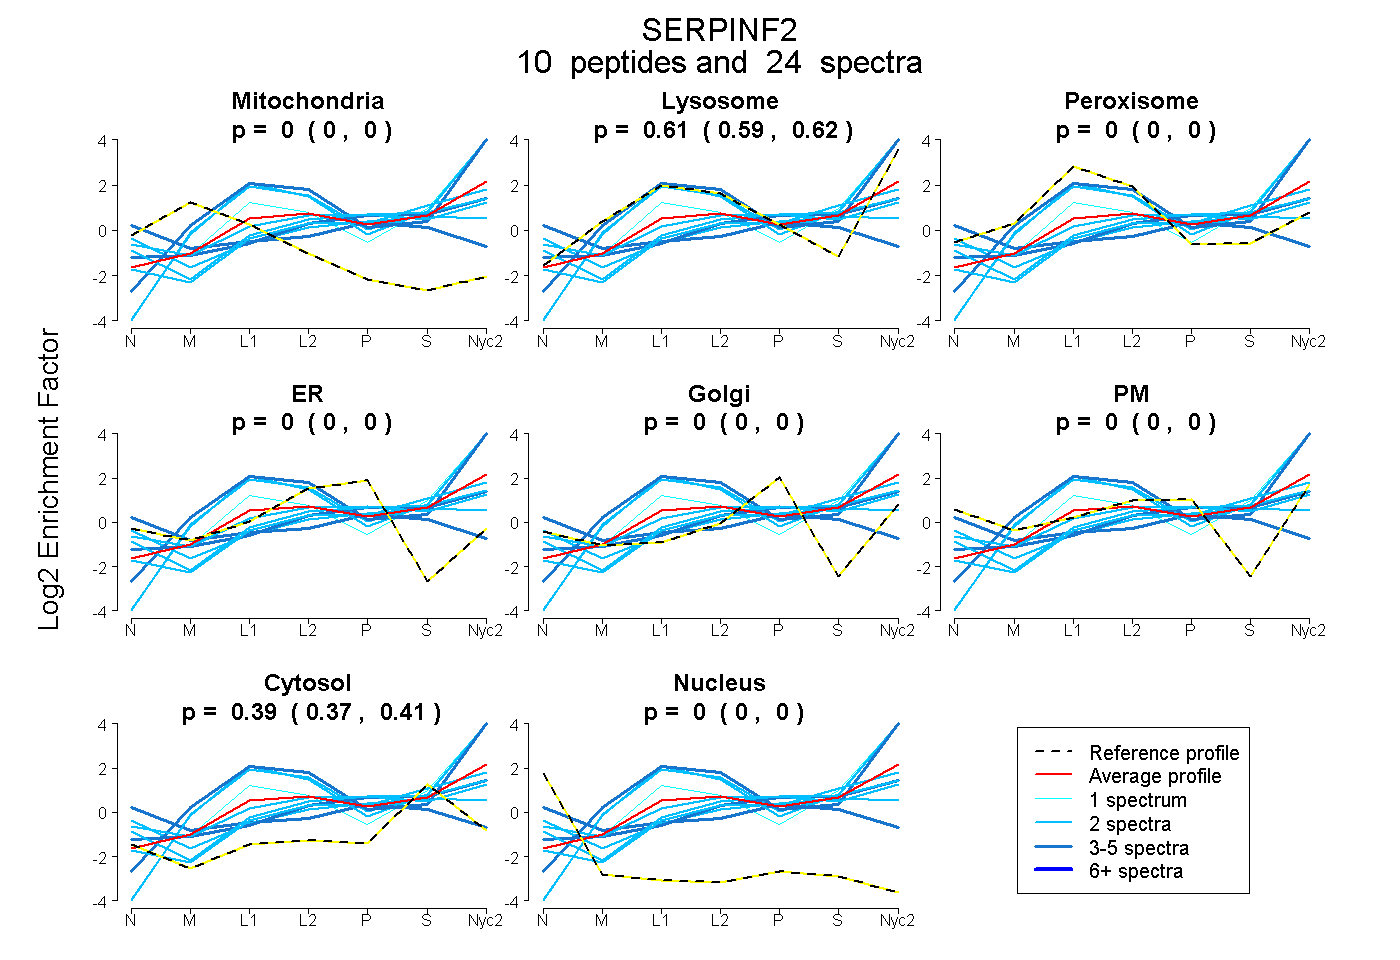
| Expt A |
10 peptides |
24 spectra |
|
0.000 0.000 | 0.000 |
0.608 0.589 | 0.623 |
0.000 0.000 | 0.000 |
0.000 0.000 | 0.000 |
0.000 0.000 | 0.000 |
0.000 0.000 | 0.000 |
0.392 0.373 | 0.407 |
0.000 0.000 | 0.000 |
| 2 spectra, TFAPDLK | 0.000 | 0.352 | 0.030 | 0.096 | 0.048 | 0.084 | 0.390 | 0.000 | ||
| 1 spectrum, FDPSLTQK | 0.000 | 0.754 | 0.000 | 0.000 | 0.000 | 0.000 | 0.246 | 0.000 | ||
| 2 spectra, DDFLEQSEK | 0.000 | 0.919 | 0.000 | 0.000 | 0.000 | 0.000 | 0.081 | 0.000 | ||
| 4 spectra, LEEDYPQFSSPK | 0.048 | 0.000 | 0.087 | 0.235 | 0.000 | 0.148 | 0.453 | 0.028 | ||
| 4 spectra, QEEDLMNINK | 0.000 | 0.971 | 0.000 | 0.000 | 0.000 | 0.000 | 0.029 | 0.000 | ||
| 2 spectra, LGNQDLGDHATLK | 0.000 | 0.104 | 0.007 | 0.046 | 0.000 | 0.293 | 0.550 | 0.000 | ||
| 2 spectra, SPGDCK | 0.000 | 0.340 | 0.000 | 0.000 | 0.176 | 0.000 | 0.484 | 0.000 | ||
| 2 spectra, SAPTTEETR | 0.000 | 0.419 | 0.000 | 0.000 | 0.007 | 0.000 | 0.574 | 0.000 | ||
| 2 spectra, LGLQDLFQSPDLR | 0.000 | 0.912 | 0.000 | 0.000 | 0.000 | 0.000 | 0.088 | 0.000 | ||
| 3 spectra, LPPLALLK | 0.000 | 0.363 | 0.000 | 0.000 | 0.186 | 0.000 | 0.451 | 0.000 |
| Plot | Mito | Lyso or Perox | ER | Golgi | PM | Cytosol | Nucleus | ||||||
| Expt B |
4 peptides |
13 spectra |
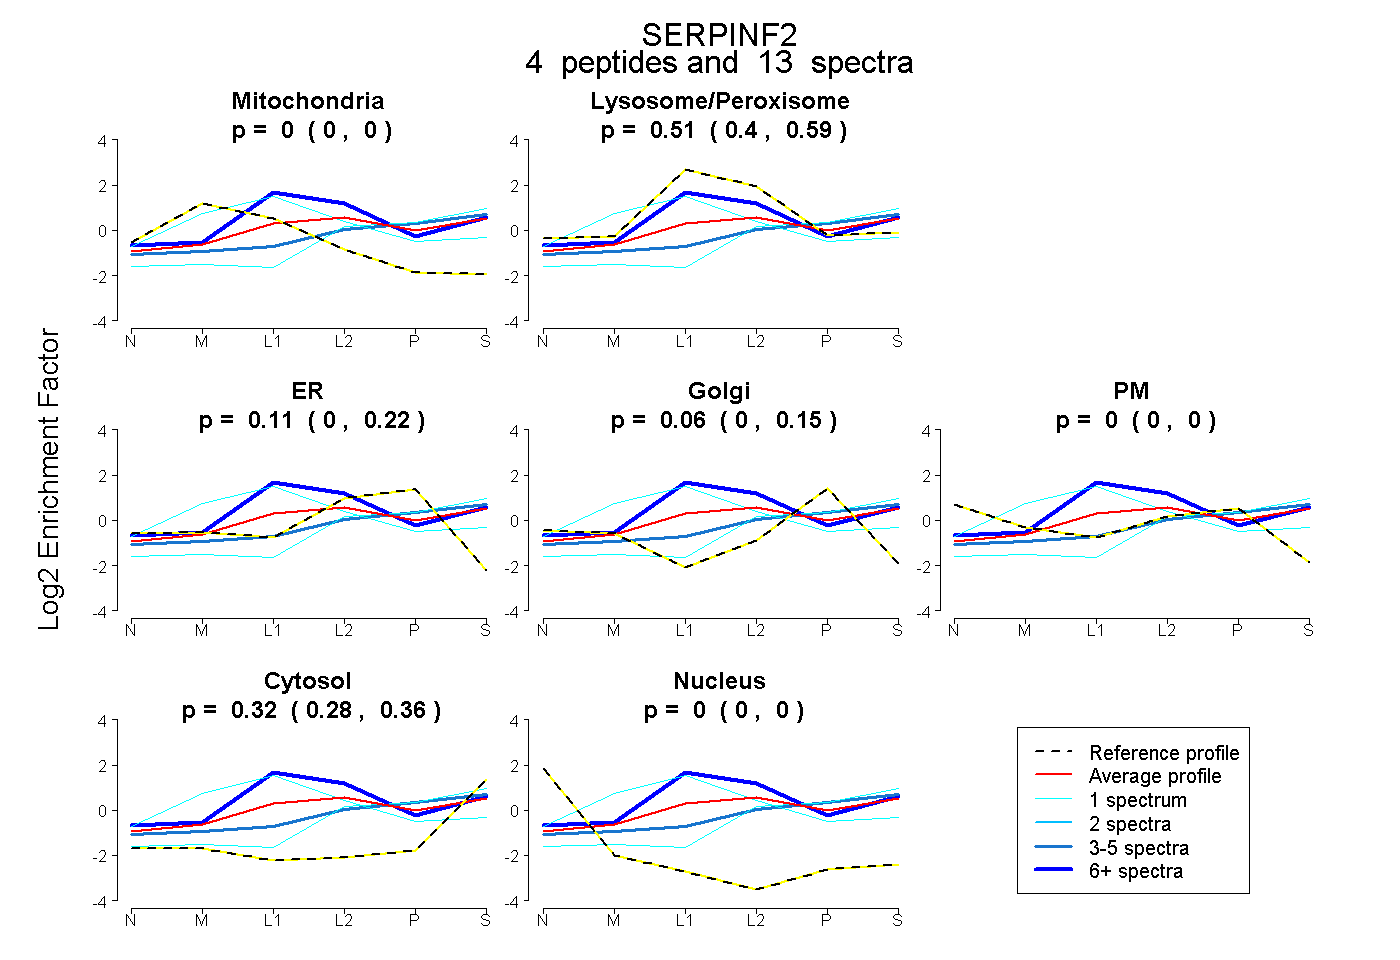 |
0.000 0.000 | 0.000 |
0.505 0.399 | 0.590 |
0.111 0.000 | 0.224 |
0.060 0.000 | 0.153 |
0.000 0.000 | 0.000 |
0.324 0.275 | 0.364 |
0.000 0.000 | 0.000 |
|||
| Plot | Lyso | Other | |||||||||||
| Expt C |
12 peptides |
173 spectra |
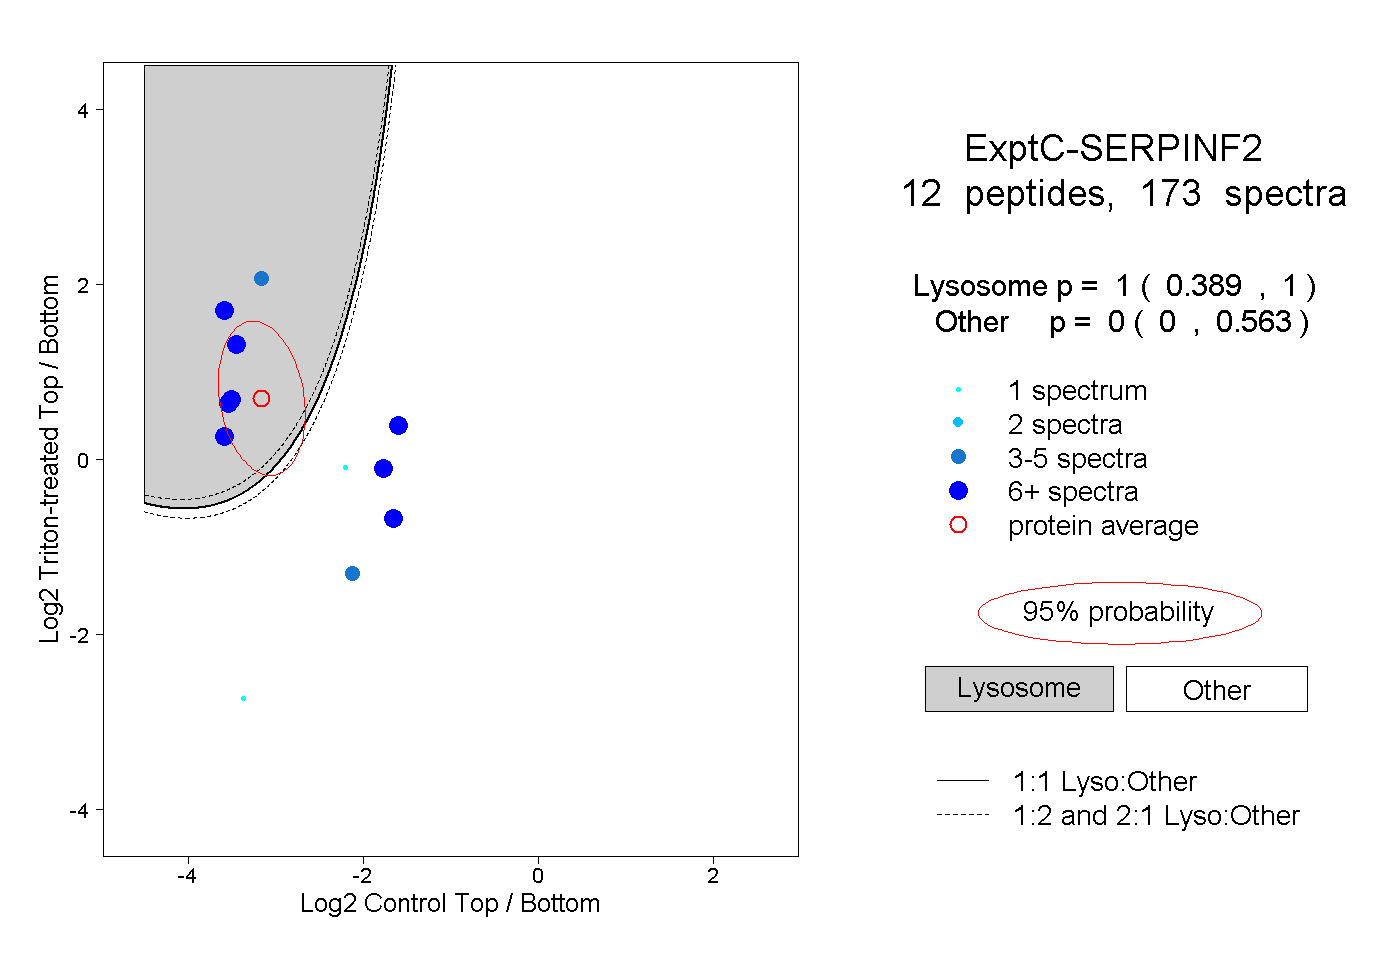 |
1.000 0.389 | 1.000 |
0.000 0.000 | 0.563 |
||||||||
| Plot | Lyso | Other | |||||||||||
| Expt D |
10 peptides |
18 spectra |
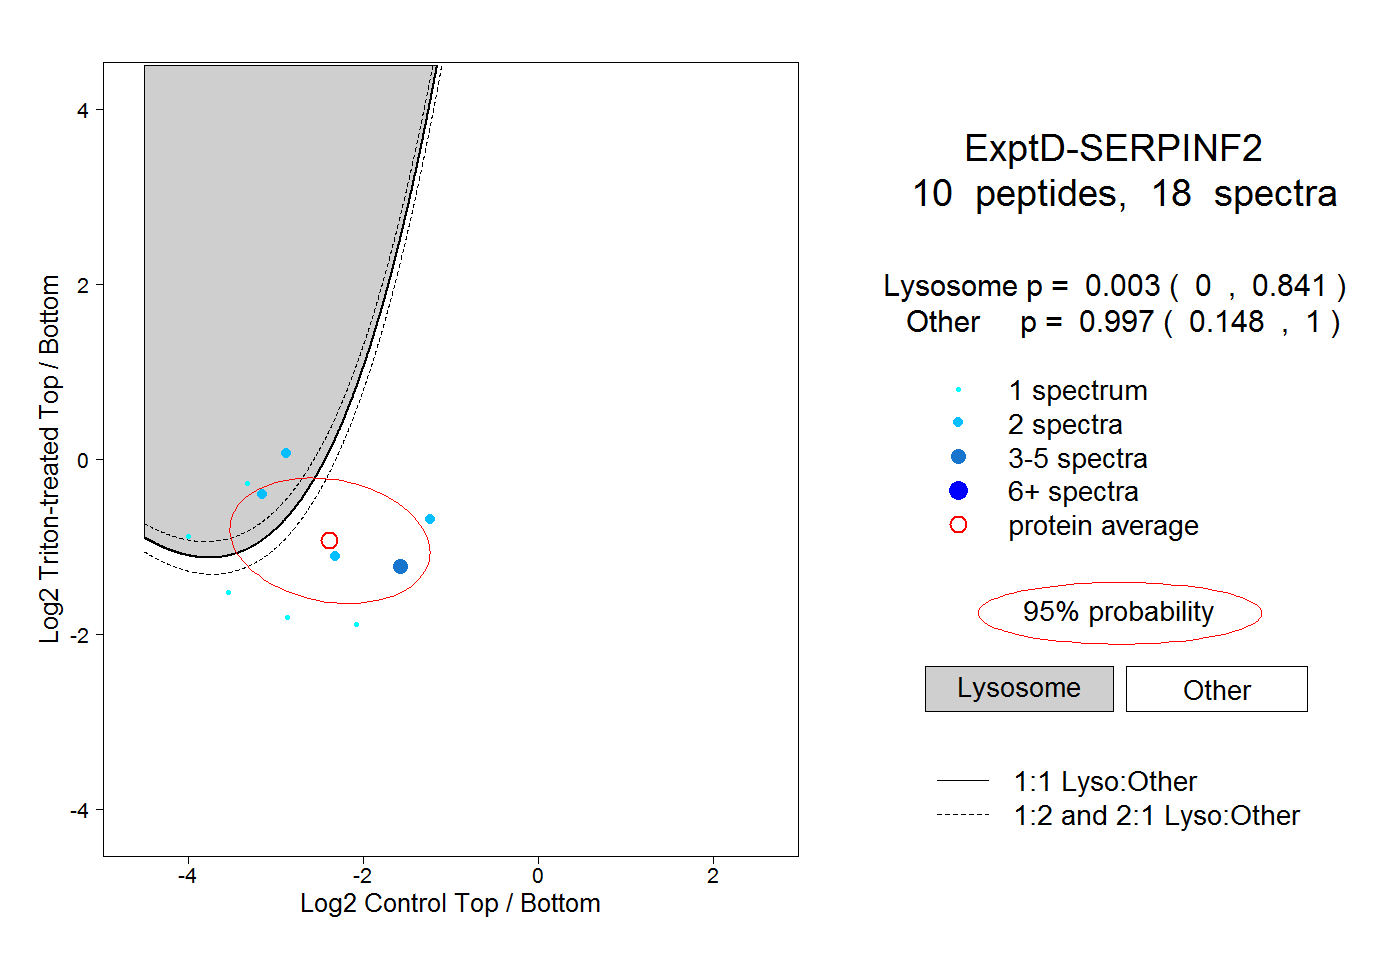 |
0.003 0.000 | 0.841 |
0.997 0.148 | 1.000 |