 2
2peptides
spectra
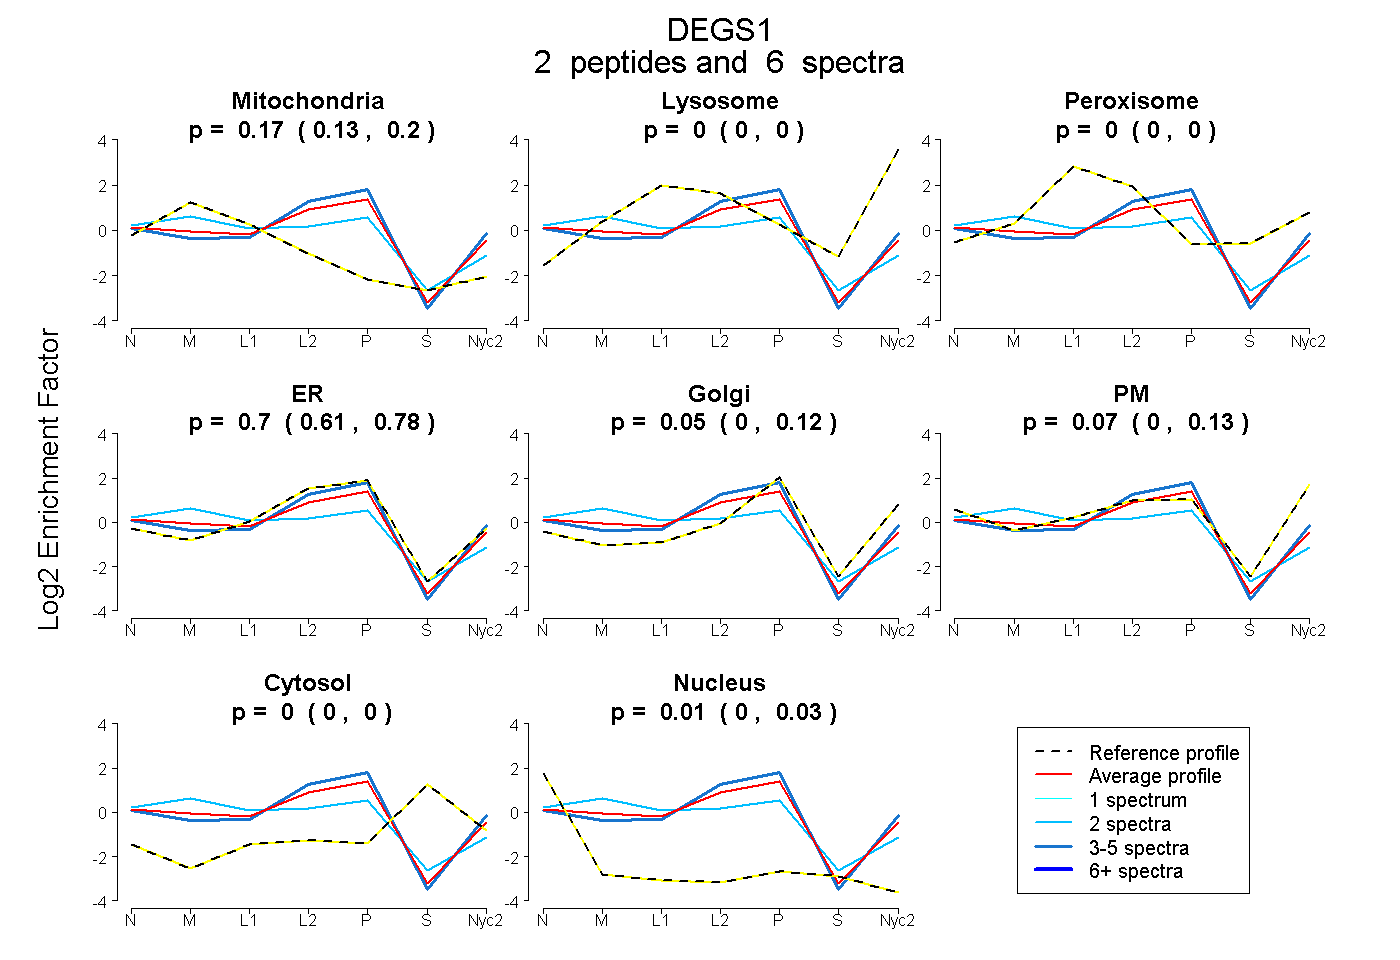
0.126 | 0.201
0.000 | 0.000
0.000 | 0.000
0.608 | 0.778
0.000 | 0.117
0.000 | 0.128
0.000 | 0.000
0.000 | 0.029
1peptide
spectra
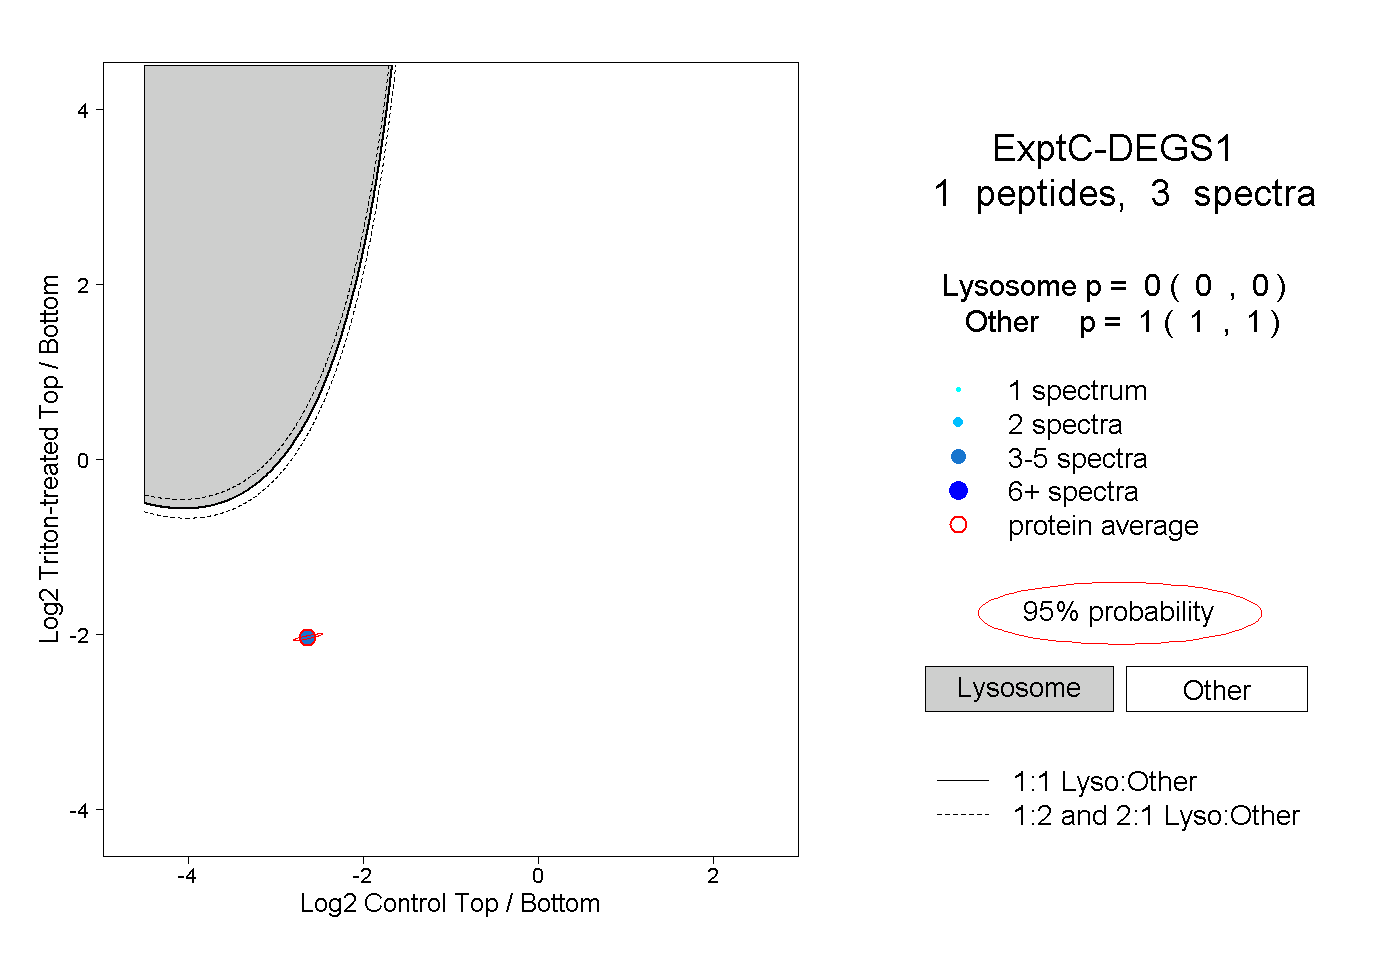
0.000 | 0.000
1.000 | 1.000
1peptide
spectrum
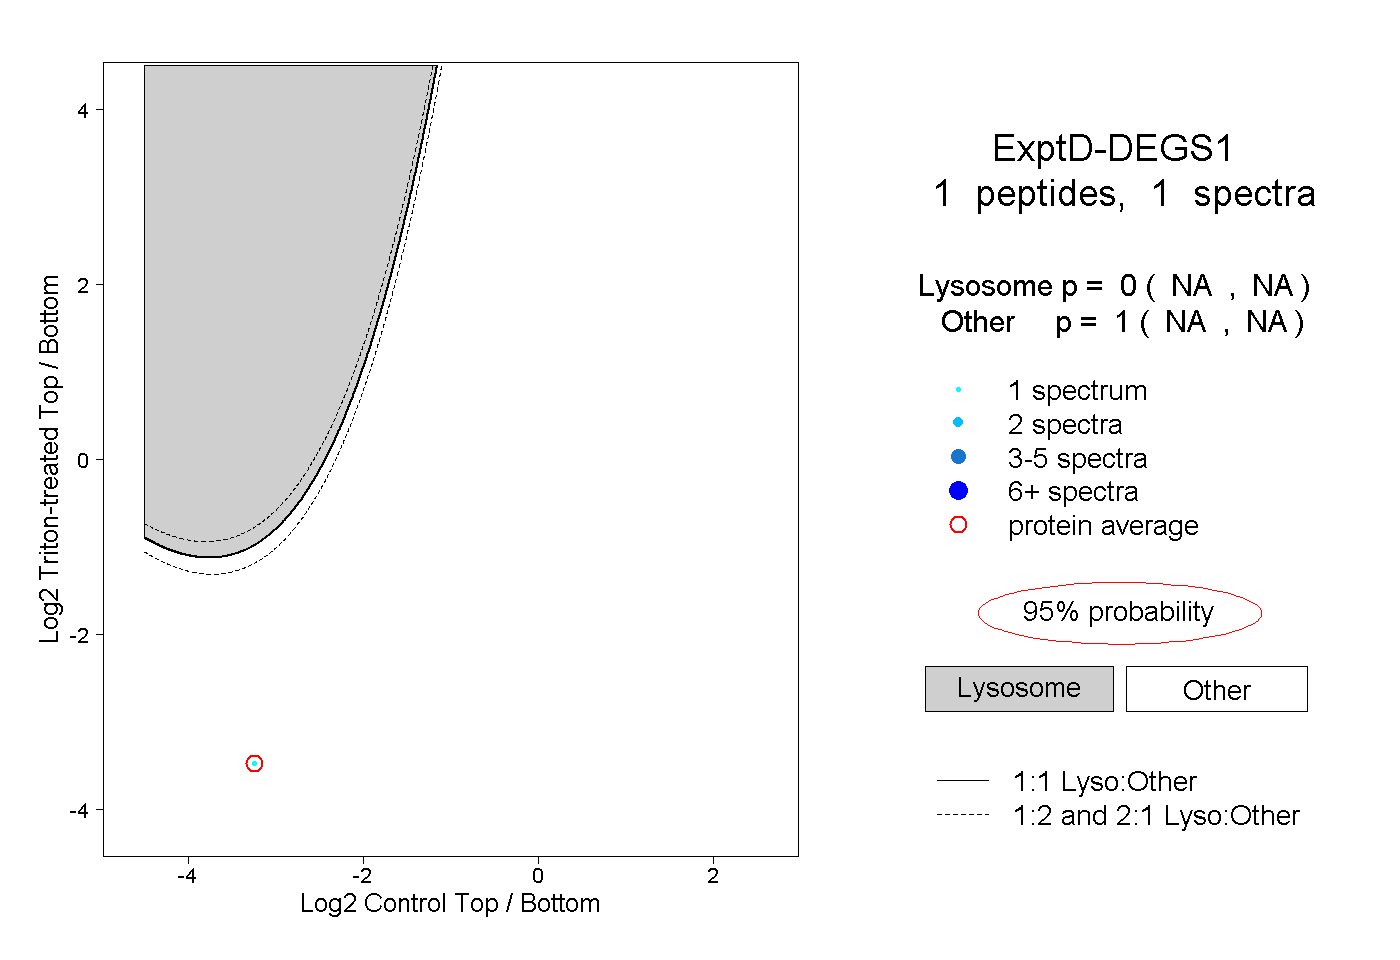
NA | NA
NA | NA