 3
3peptides
spectra
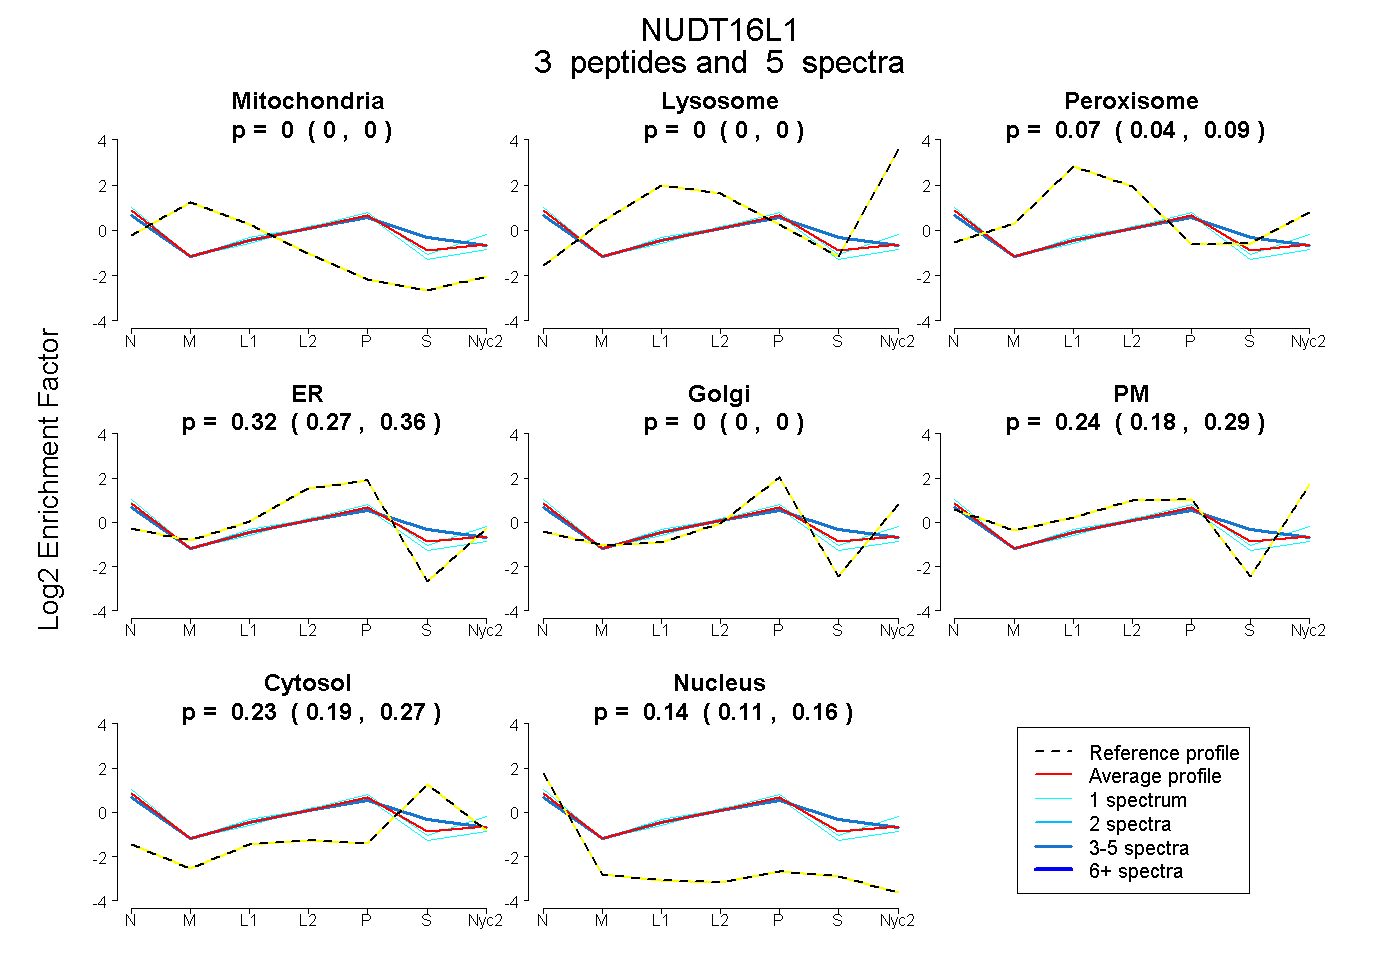
0.000 | 0.000
0.000 | 0.000
0.045 | 0.086
0.273 | 0.358
0.000 | 0.000
0.184 | 0.292
0.185 | 0.267
0.115 | 0.162
1peptide
spectrum
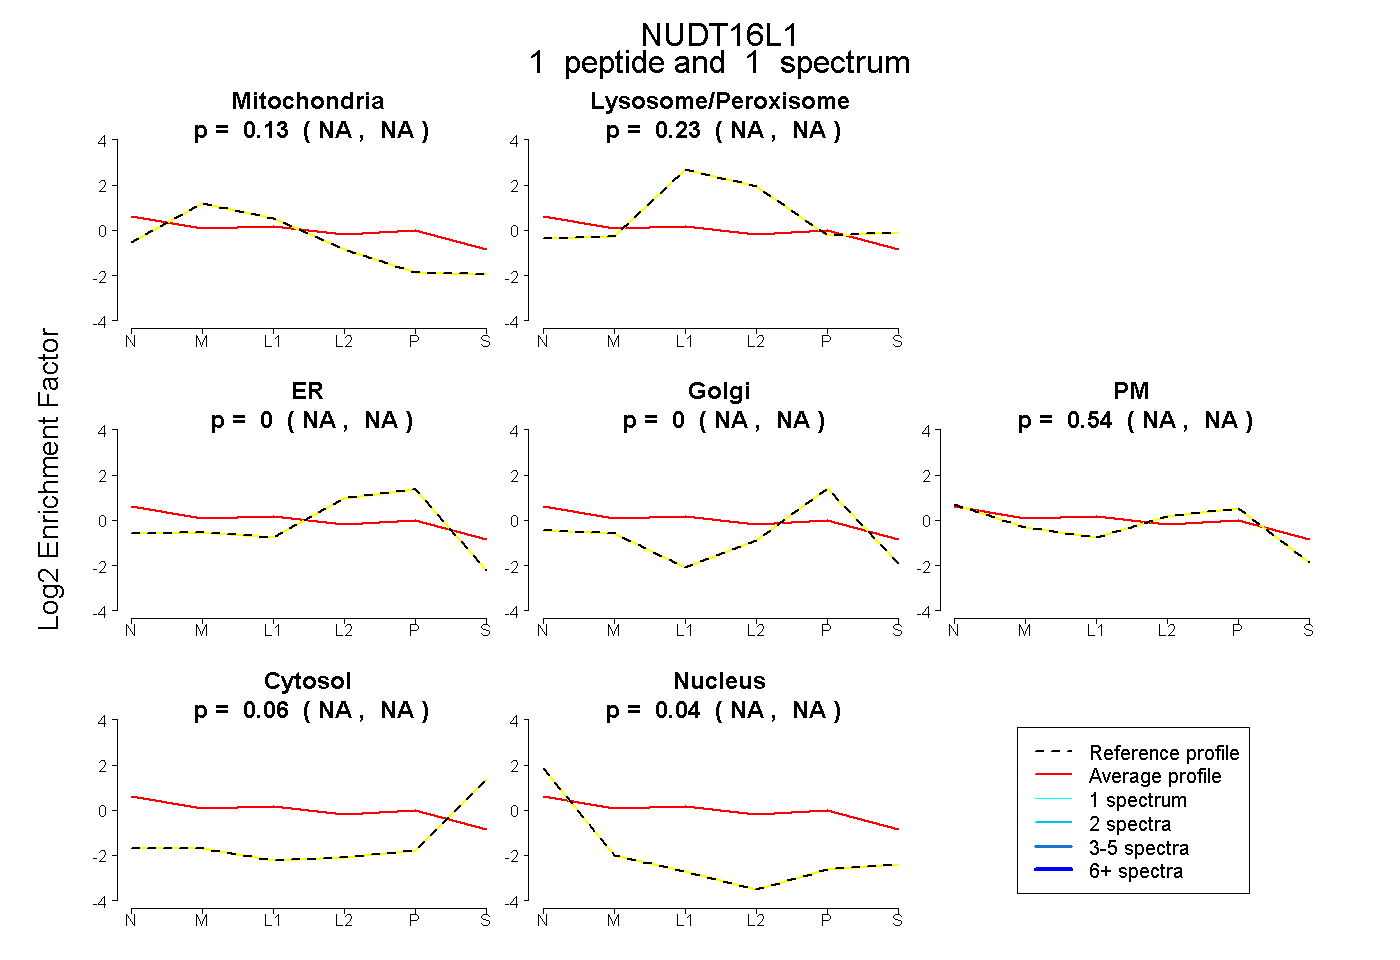
NA | NA
NA | NA
NA | NA
NA | NA
NA | NA
NA | NA
NA | NA
1peptide
spectra
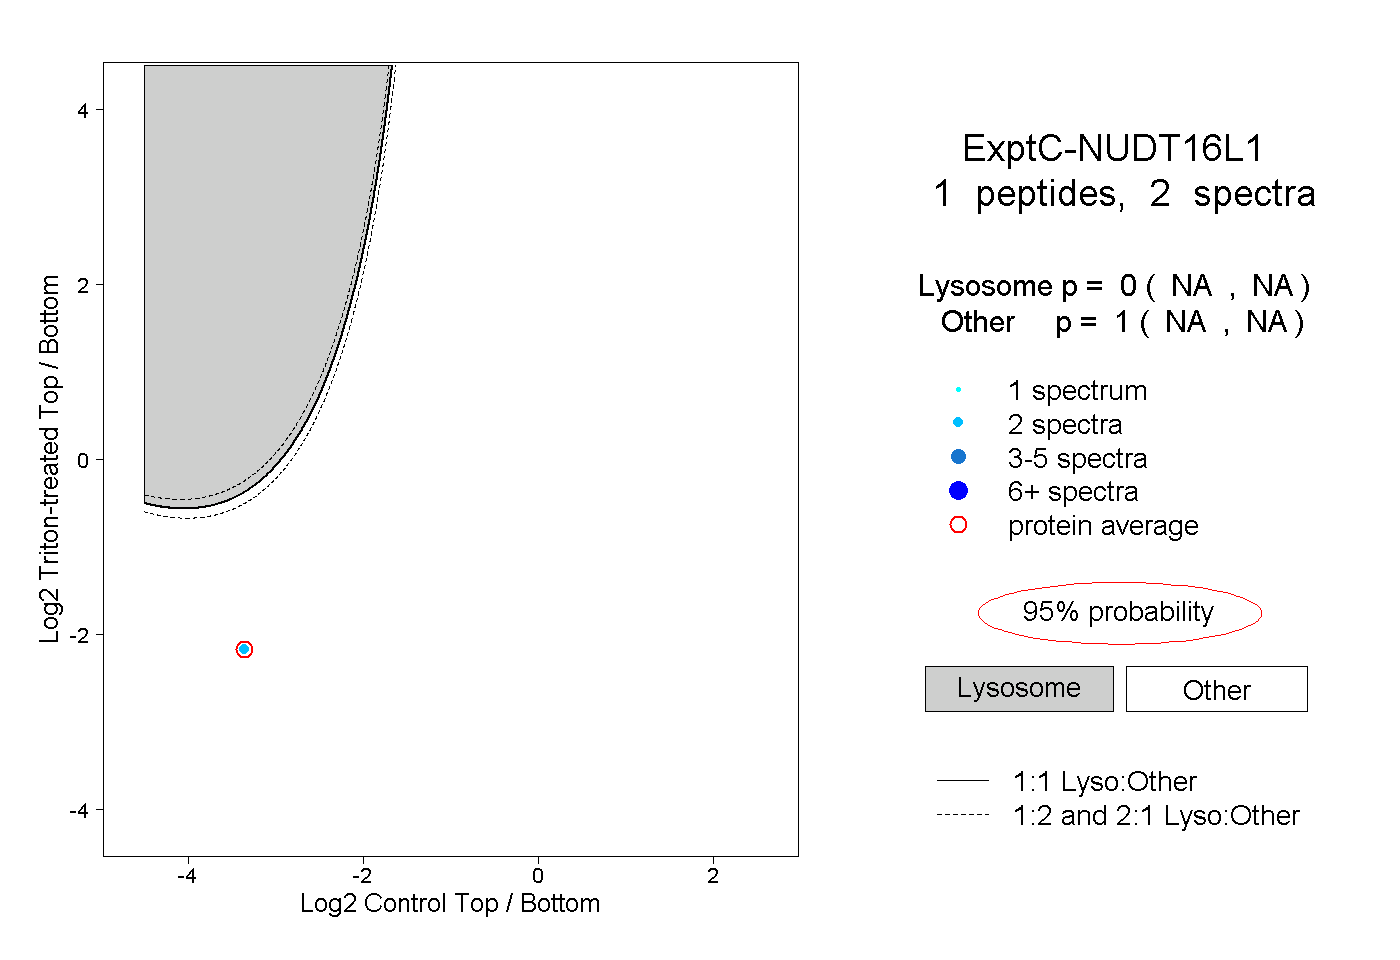
NA | NA
NA | NA