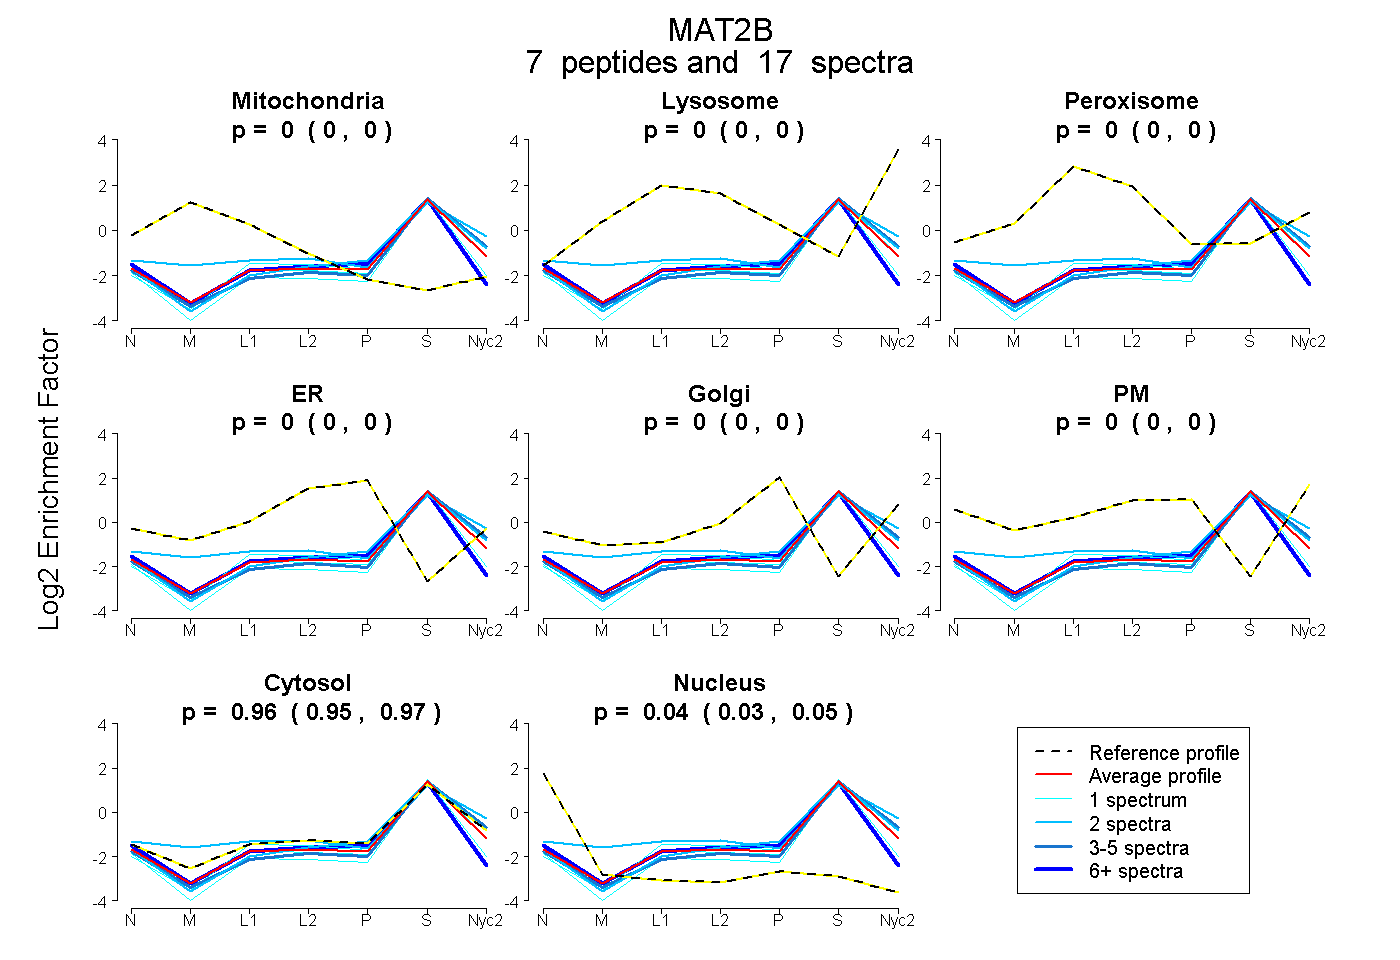
 7
7peptides
spectra
0.000 | 0.000
0.000 | 0.000
0.000 | 0.000
0.000 | 0.000
0.000 | 0.000
0.000 | 0.000
0.951 | 0.972
0.027 | 0.046
| Plot | Mito | Lyso | Perox | ER | Golgi | PM | Cytosol | Nucleus | |||||
| Expt A |
7 peptides |
17 spectra |
|
0.000 0.000 | 0.000 |
0.000 0.000 | 0.000 |
0.000 0.000 | 0.000 |
0.000 0.000 | 0.000 |
0.000 0.000 | 0.000 |
0.000 0.000 | 0.000 |
0.963 0.951 | 0.972 |
0.037 0.027 | 0.046 |
| 2 spectra, VQFSNK | 0.000 | 0.000 | 0.000 | 0.000 | 0.000 | 0.000 | 0.994 | 0.006 | ||
| 2 spectra, LETLGIGQR | 0.059 | 0.073 | 0.000 | 0.000 | 0.000 | 0.000 | 0.868 | 0.000 | ||
| 1 spectrum, ESLWPFLIDK | 0.000 | 0.000 | 0.000 | 0.000 | 0.000 | 0.000 | 0.939 | 0.061 | ||
| 1 spectrum, AVLENNLGAAVLR | 0.000 | 0.000 | 0.000 | 0.000 | 0.000 | 0.000 | 0.983 | 0.017 | ||
| 3 spectra, VLITGATGLLGR | 0.000 | 0.000 | 0.000 | 0.000 | 0.000 | 0.000 | 0.975 | 0.025 | ||
| 7 spectra, DVASVCR | 0.000 | 0.000 | 0.000 | 0.000 | 0.000 | 0.000 | 0.881 | 0.119 | ||
| 1 spectrum, FPTHVK | 0.000 | 0.000 | 0.000 | 0.000 | 0.000 | 0.000 | 0.956 | 0.044 |
| Plot | Mito | Lyso or Perox | ER | Golgi | PM | Cytosol | Nucleus | ||||||
| Expt B |
2 peptides |
3 spectra |
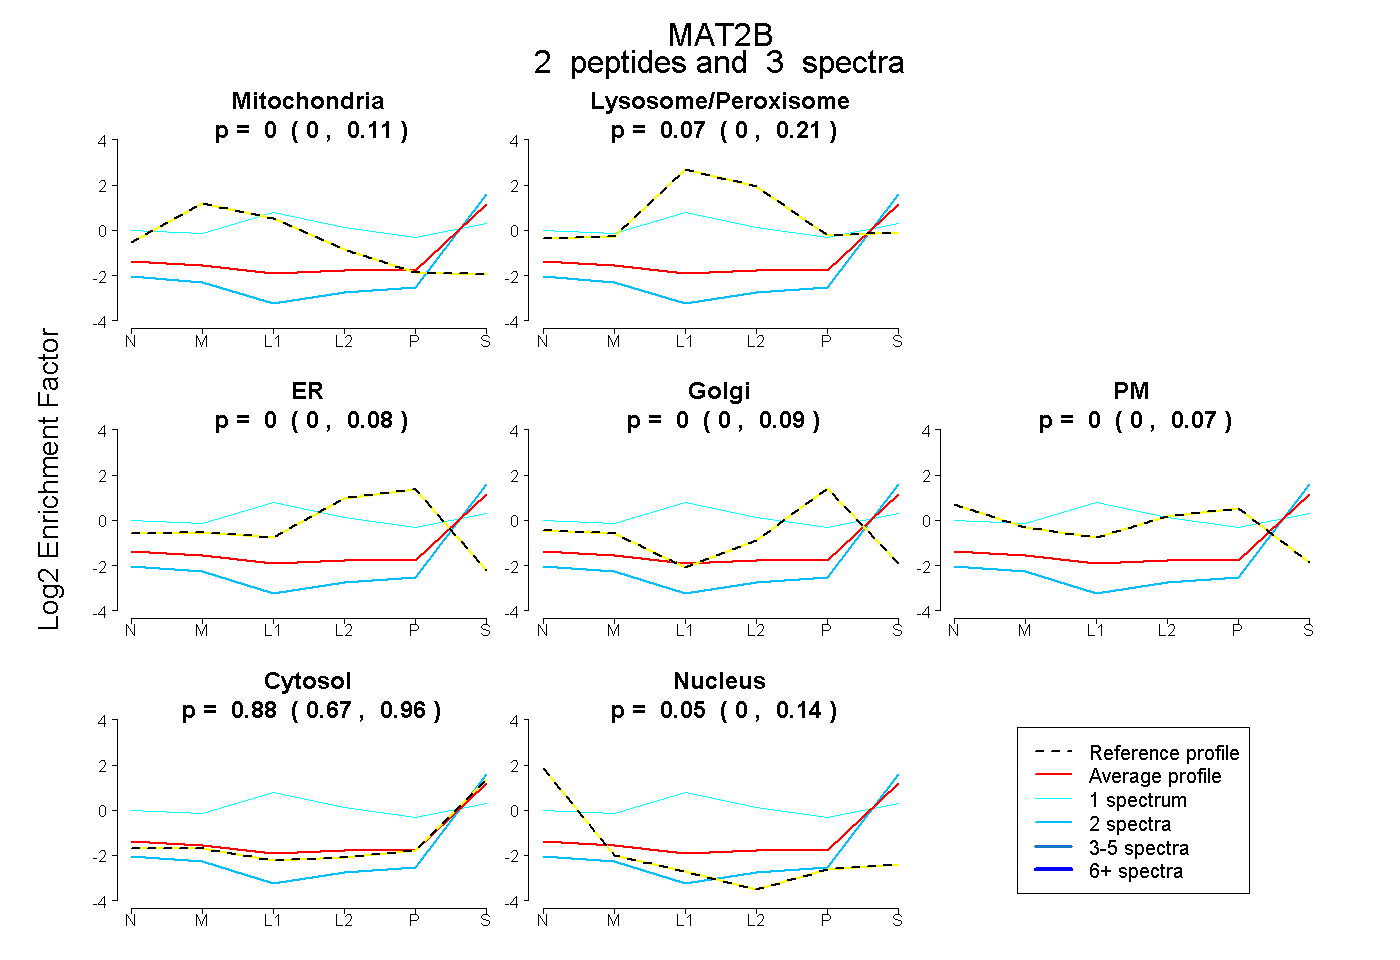 |
0.000 0.000 | 0.115 |
0.074 0.000 | 0.213 |
0.000 0.000 | 0.081 |
0.000 0.000 | 0.089 |
0.000 0.000 | 0.070 |
0.879 0.670 | 0.957 |
0.046 0.000 | 0.137 |
|||
| Plot | Lyso | Other | |||||||||||
| Expt C |
5 peptides |
7 spectra |
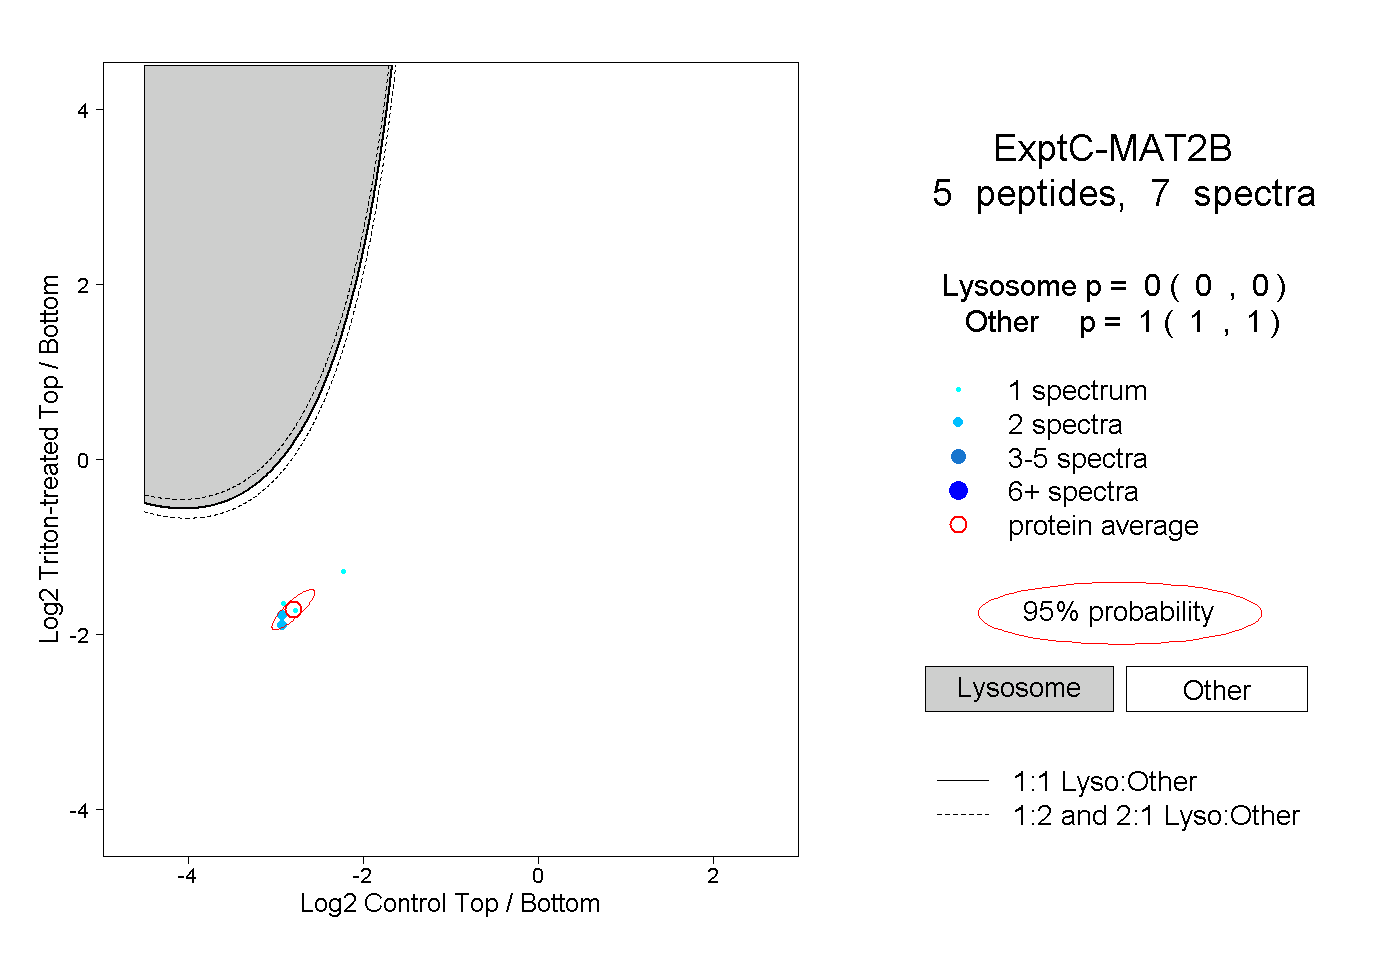 |
0.000 0.000 | 0.000 |
1.000 1.000 | 1.000 |