 20
20peptides
spectra
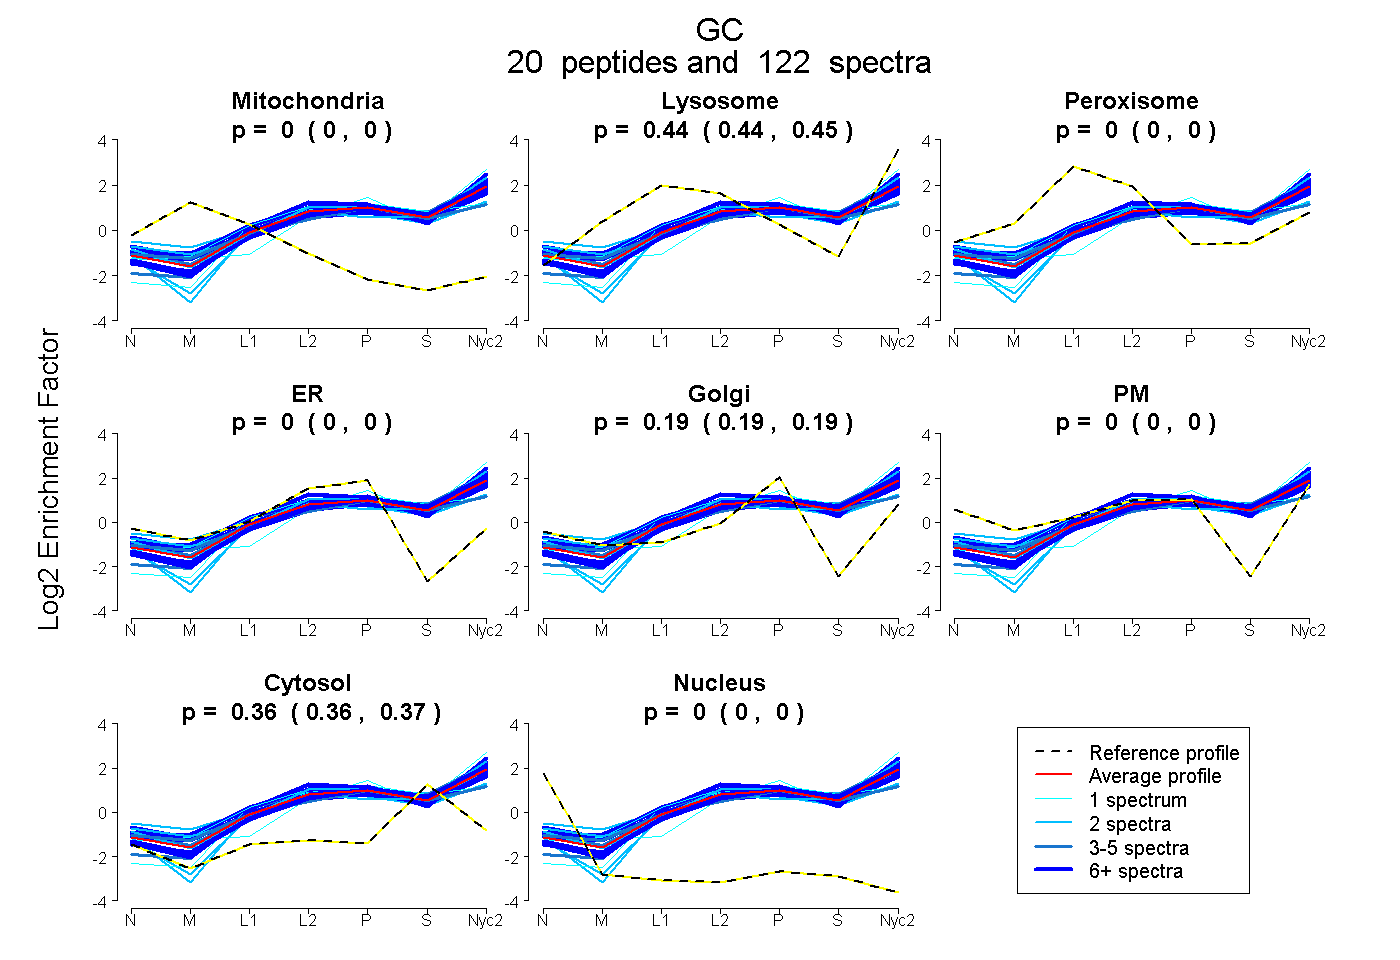
0.000 | 0.000
0.441 | 0.445
0.000 | 0.000
0.000 | 0.000
0.190 | 0.194
0.000 | 0.000
0.363 | 0.366
0.000 | 0.000
11peptides
spectra
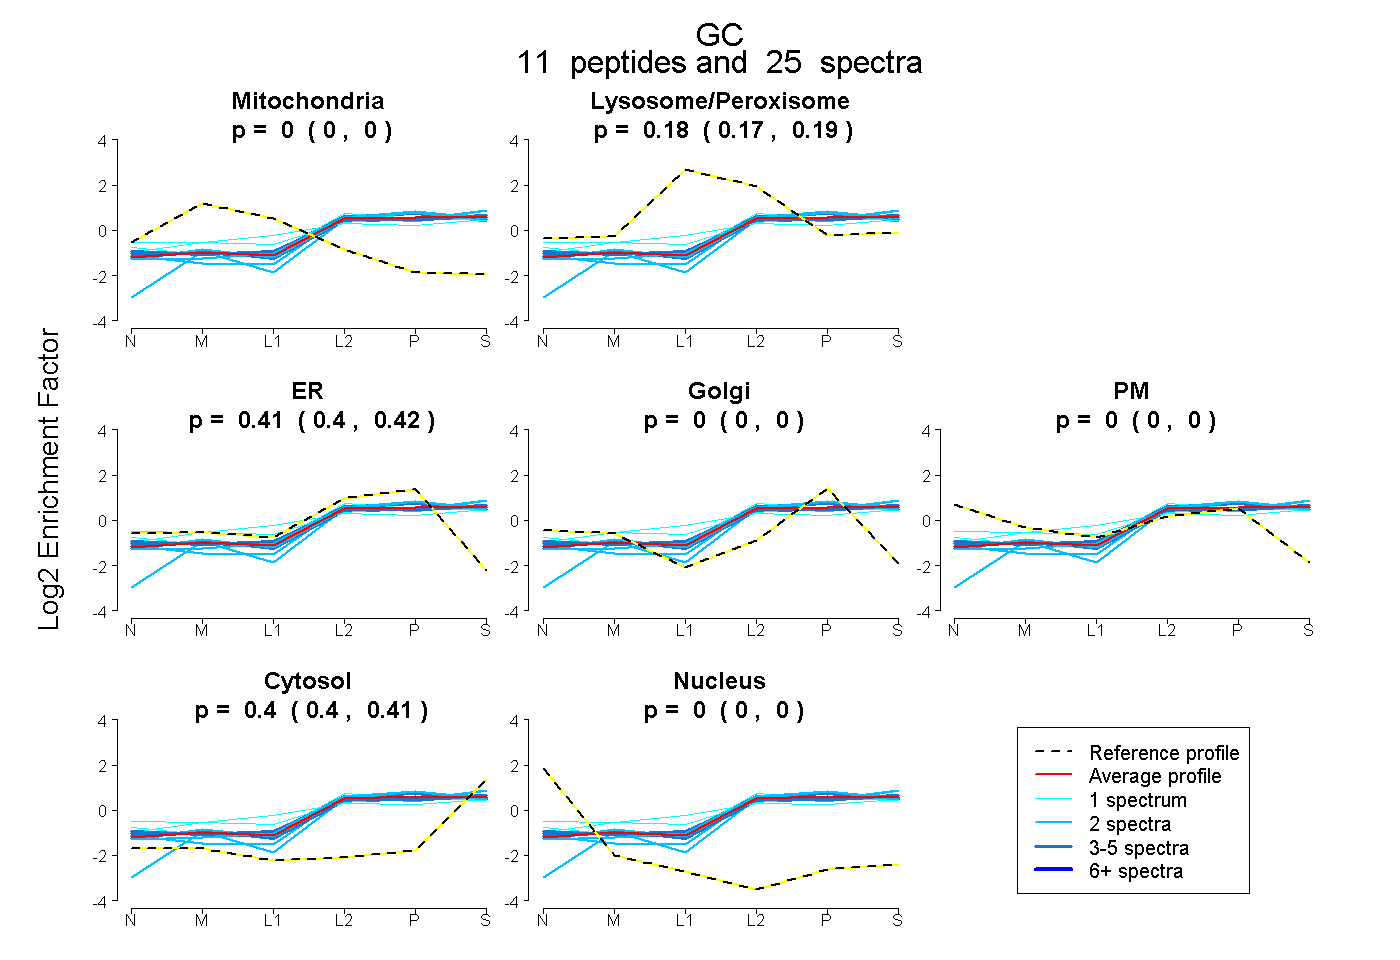
0.000 | 0.000
0.174 | 0.191
0.404 | 0.418
0.000 | 0.000
0.000 | 0.000
0.400 | 0.408
0.000 | 0.000
17peptides
spectra
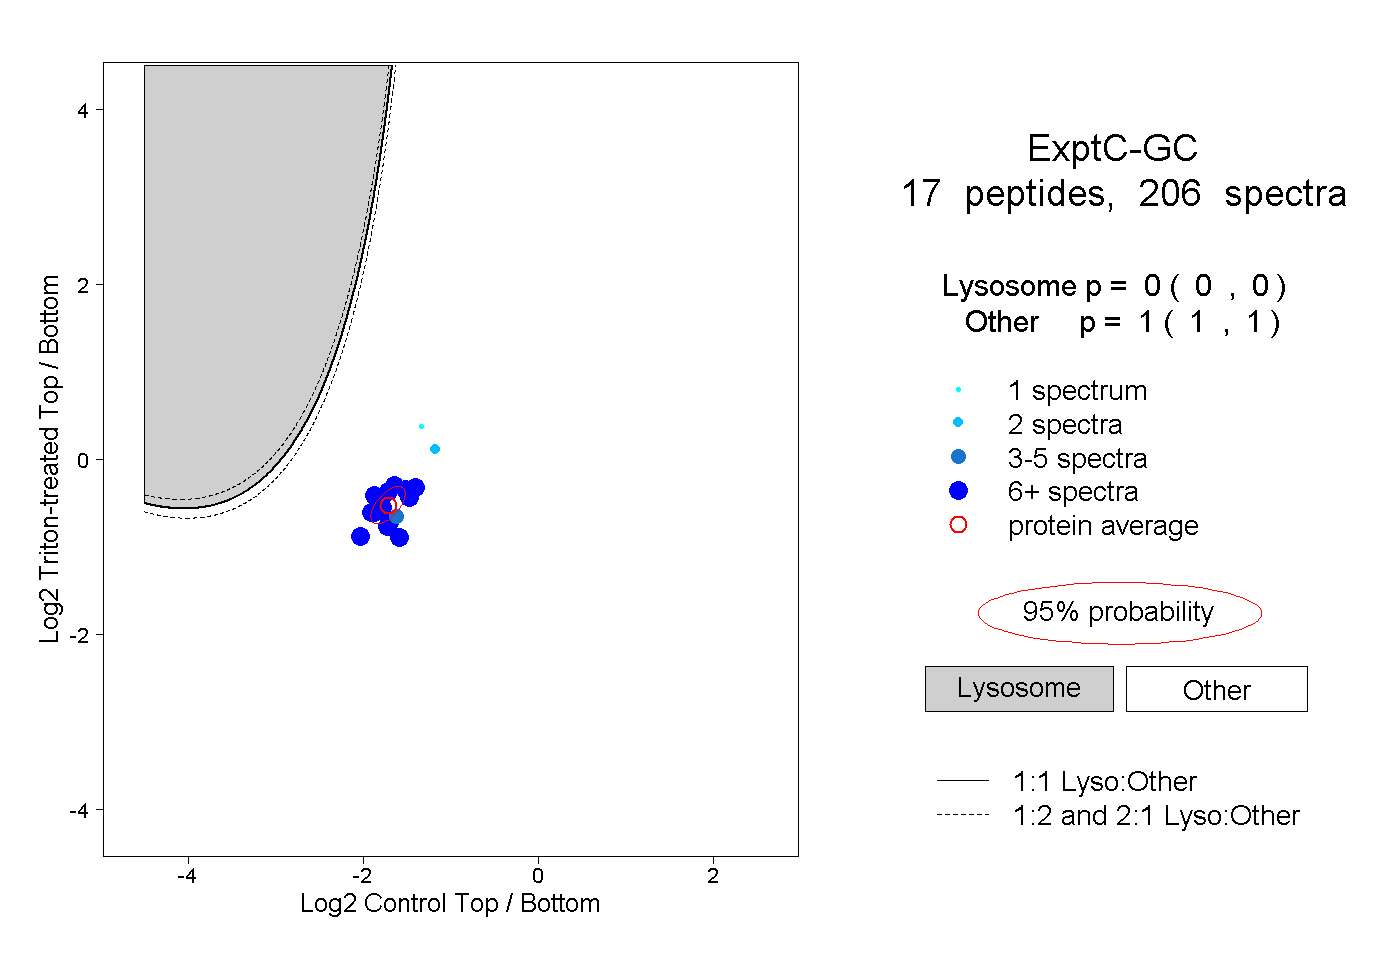
0.000 | 0.000
1.000 | 1.000
9peptides
spectra
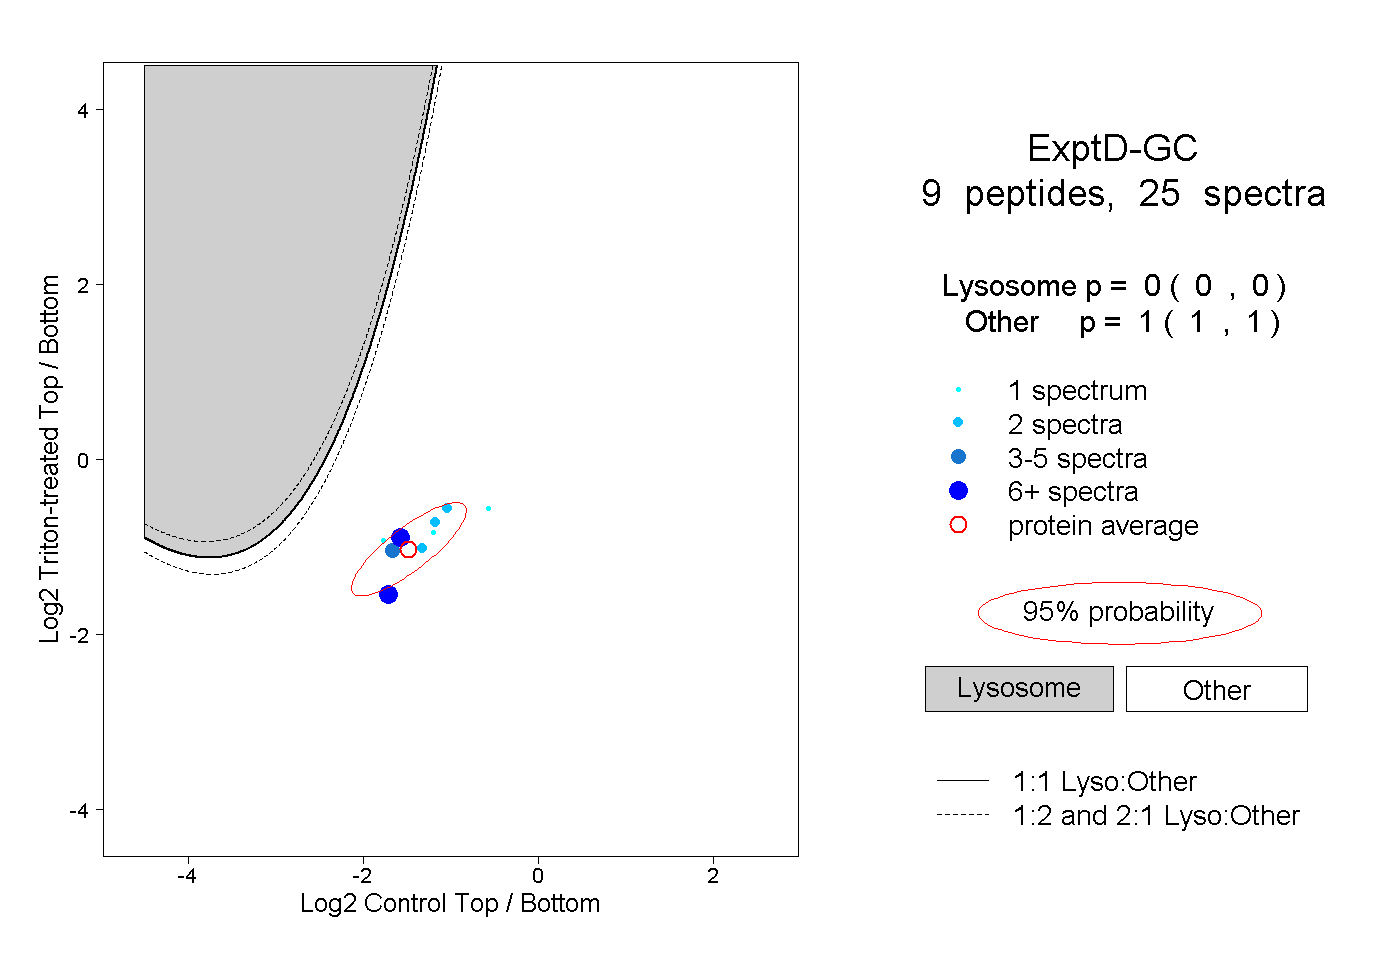
0.000 | 0.000
1.000 | 1.000