 6
6peptides
spectra
0.964 | 0.991
0.000 | 0.000
0.000 | 0.000
0.000 | 0.000
0.000 | 0.000
0.000 | 0.000
0.000 | 0.000
0.006 | 0.033
| Plot | Mito | Lyso | Perox | ER | Golgi | PM | Cytosol | Nucleus | |||||
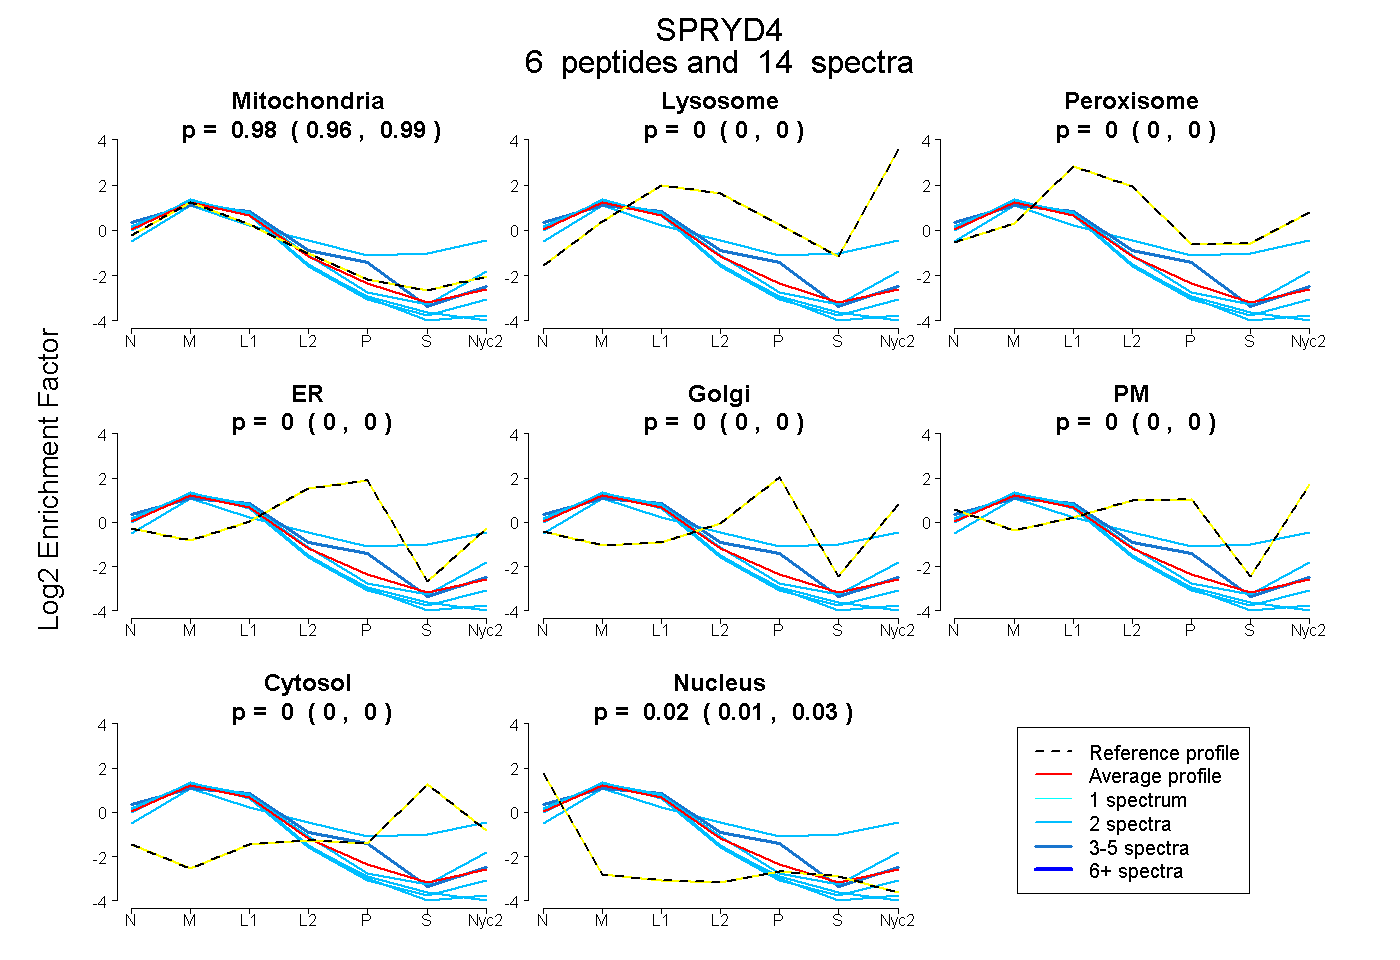
| Expt A |
6 peptides |
14 spectra |
|
0.979 0.964 | 0.991 |
0.000 0.000 | 0.000 |
0.000 0.000 | 0.000 |
0.000 0.000 | 0.000 |
0.000 0.000 | 0.000 |
0.000 0.000 | 0.000 |
0.000 0.000 | 0.000 |
0.021 0.006 | 0.033 |
| 4 spectra, ISVIHTLQTDFR | 0.897 | 0.000 | 0.000 | 0.095 | 0.000 | 0.000 | 0.000 | 0.008 | ||
| 2 spectra, VGLLLDYEAK | 0.906 | 0.000 | 0.000 | 0.000 | 0.000 | 0.000 | 0.000 | 0.094 | ||
| 2 spectra, LSLVDVNR | 1.000 | 0.000 | 0.000 | 0.000 | 0.000 | 0.000 | 0.000 | 0.000 | ||
| 2 spectra, DSCVGADDR | 0.909 | 0.000 | 0.000 | 0.000 | 0.000 | 0.000 | 0.000 | 0.091 | ||
| 2 spectra, SWVFSYAQR | 0.939 | 0.000 | 0.000 | 0.000 | 0.000 | 0.000 | 0.000 | 0.061 | ||
| 2 spectra, HYWEVTVK | 0.567 | 0.232 | 0.029 | 0.000 | 0.001 | 0.006 | 0.166 | 0.000 |
| Plot | Mito | Lyso or Perox | ER | Golgi | PM | Cytosol | Nucleus | ||||||
| Expt B |
7 peptides |
8 spectra |
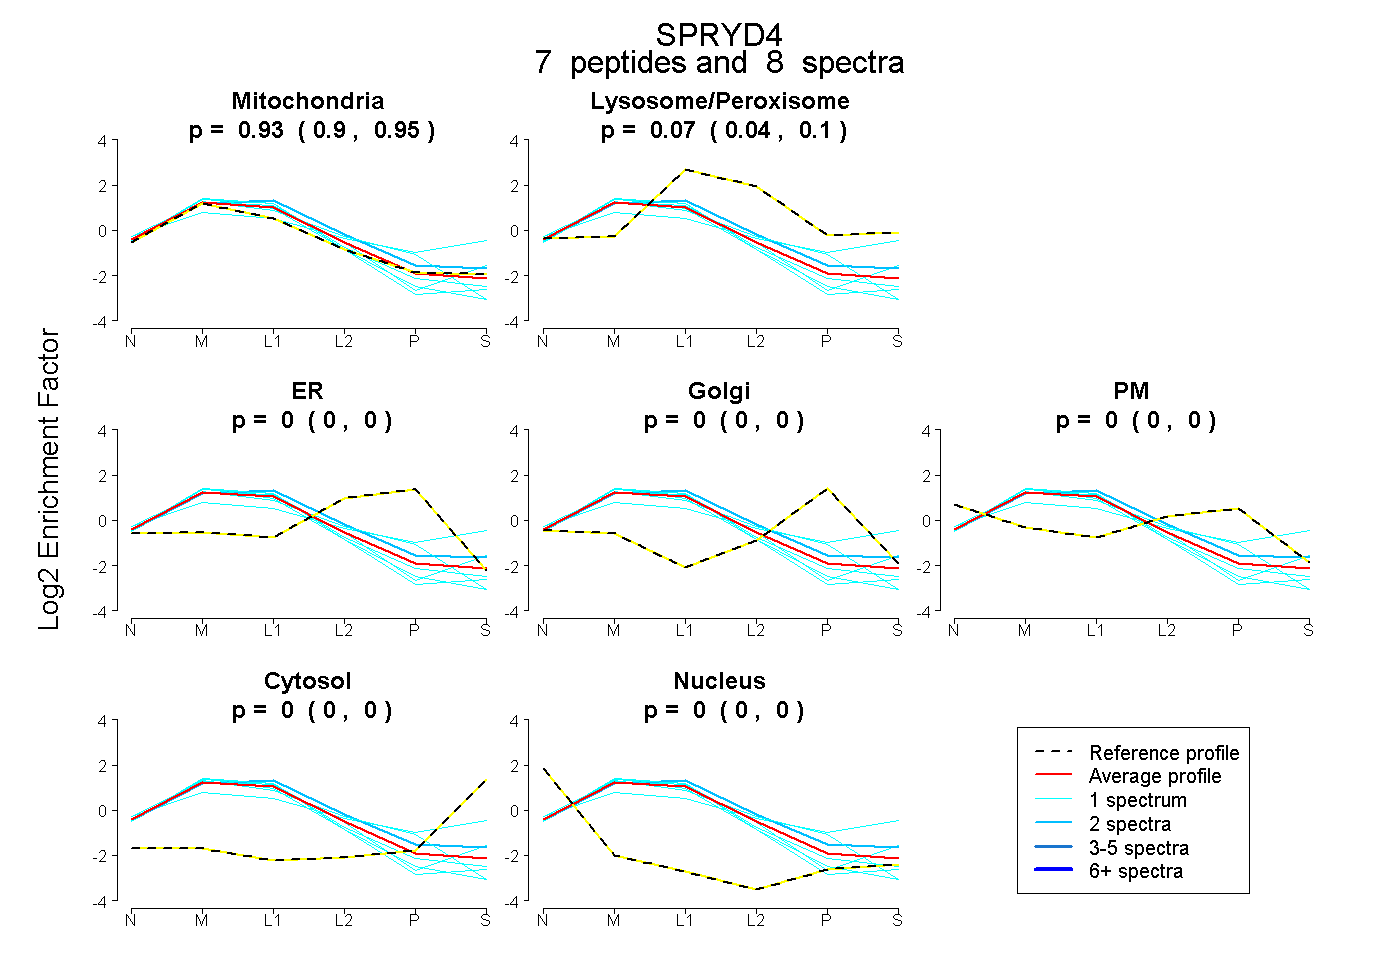 |
0.928 0.898 | 0.954 |
0.072 0.042 | 0.097 |
0.000 0.000 | 0.000 |
0.000 0.000 | 0.000 |
0.000 0.000 | 0.000 |
0.000 0.000 | 0.000 |
0.000 0.000 | 0.000 |
|||
| Plot | Lyso | Other | |||||||||||
| Expt C |
13 peptides |
70 spectra |
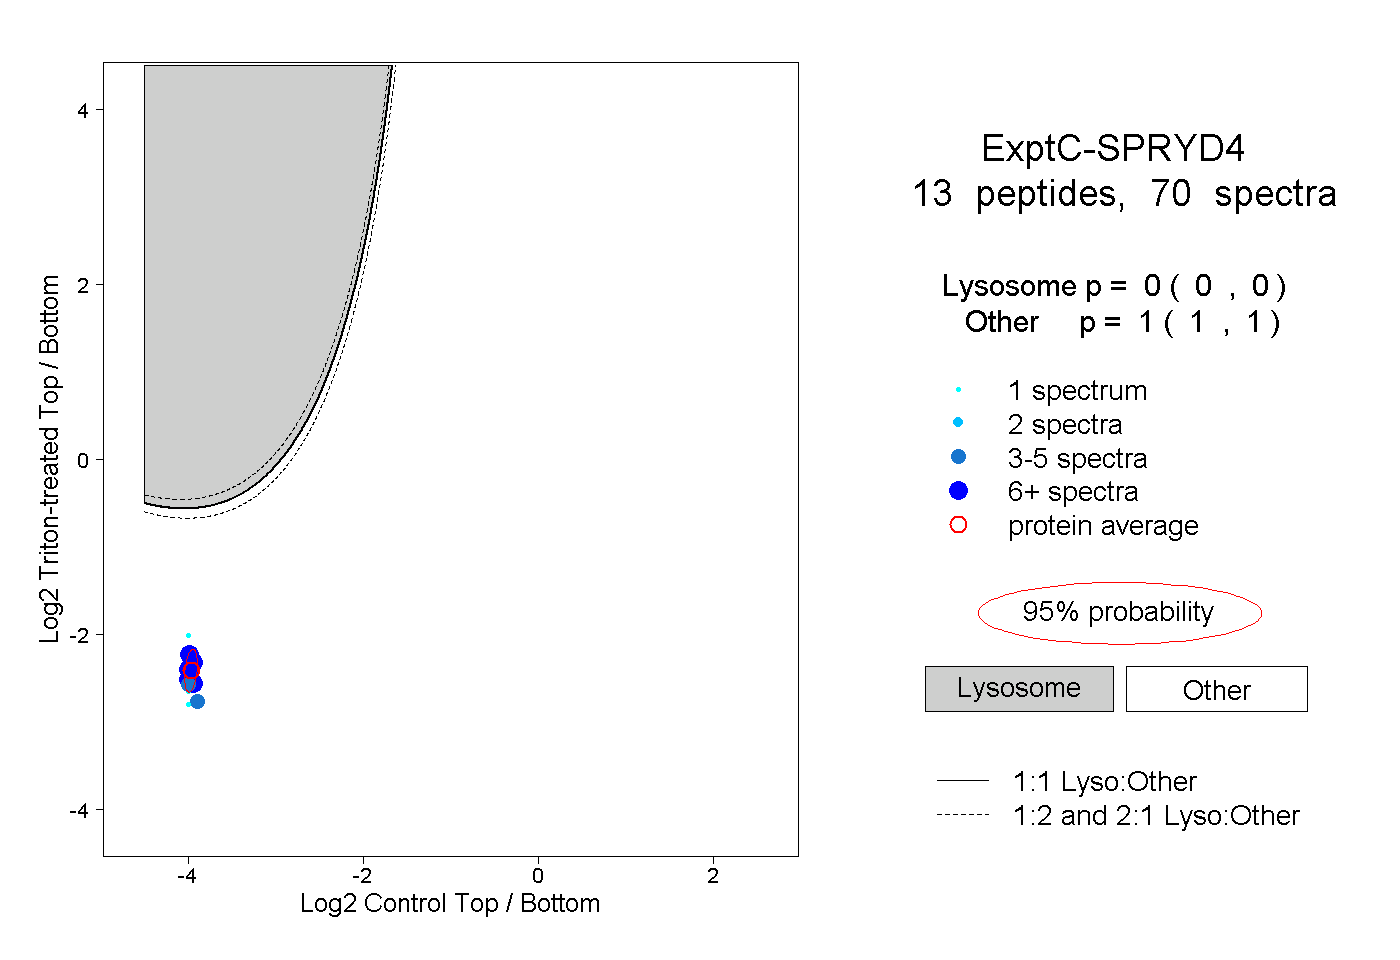 |
0.000 0.000 | 0.000 |
1.000 1.000 | 1.000 |
||||||||
| Plot | Lyso | Other | |||||||||||
| Expt D |
5 peptides |
7 spectra |
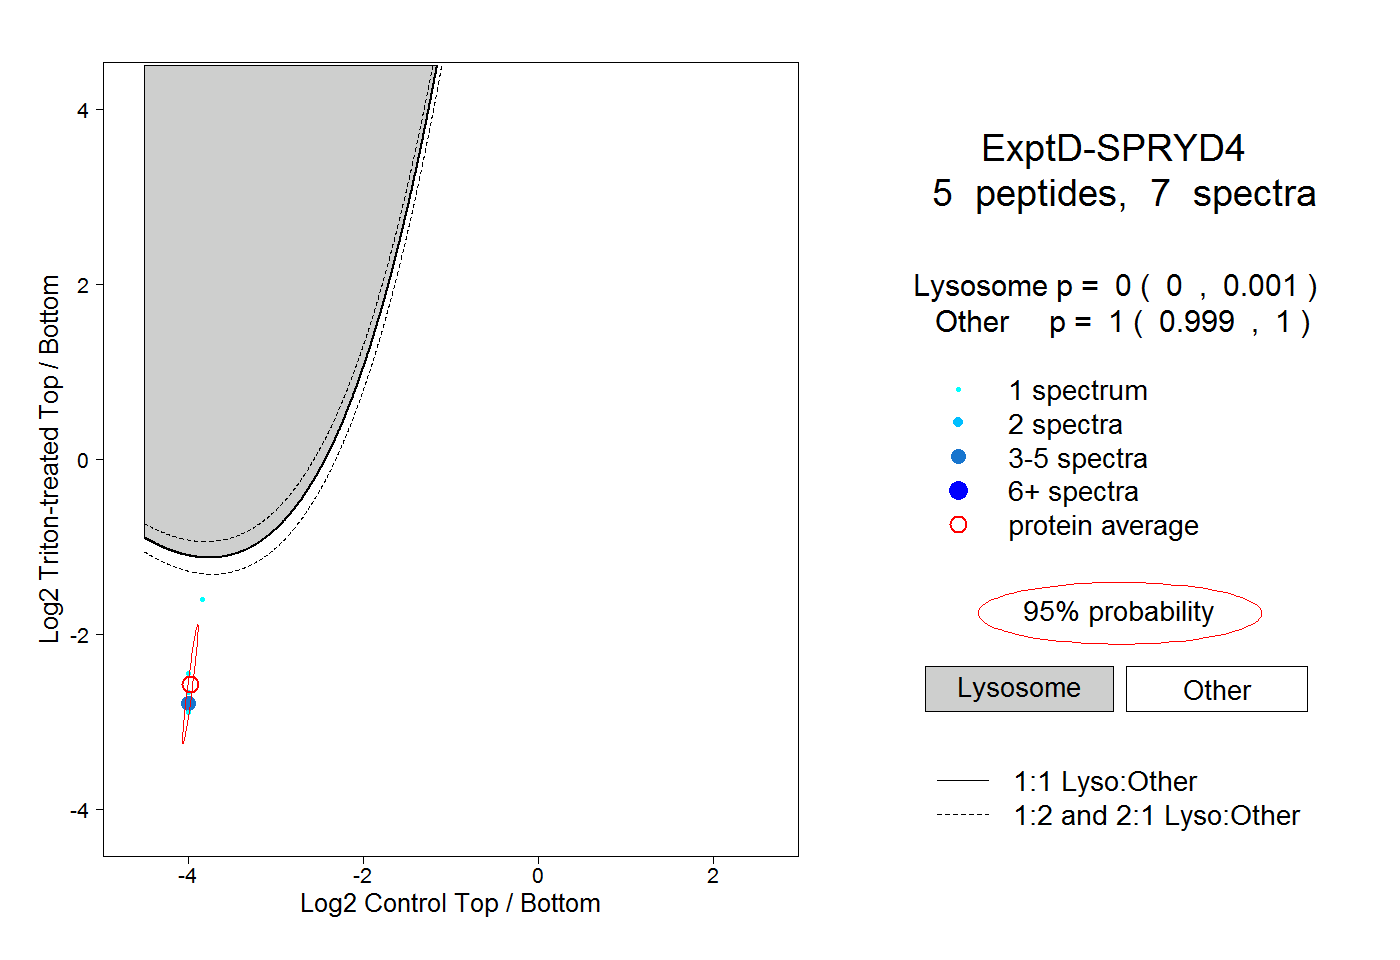 |
0.000 0.000 | 0.001 |
1.000 0.999 | 1.000 |