 9
9peptides
spectra
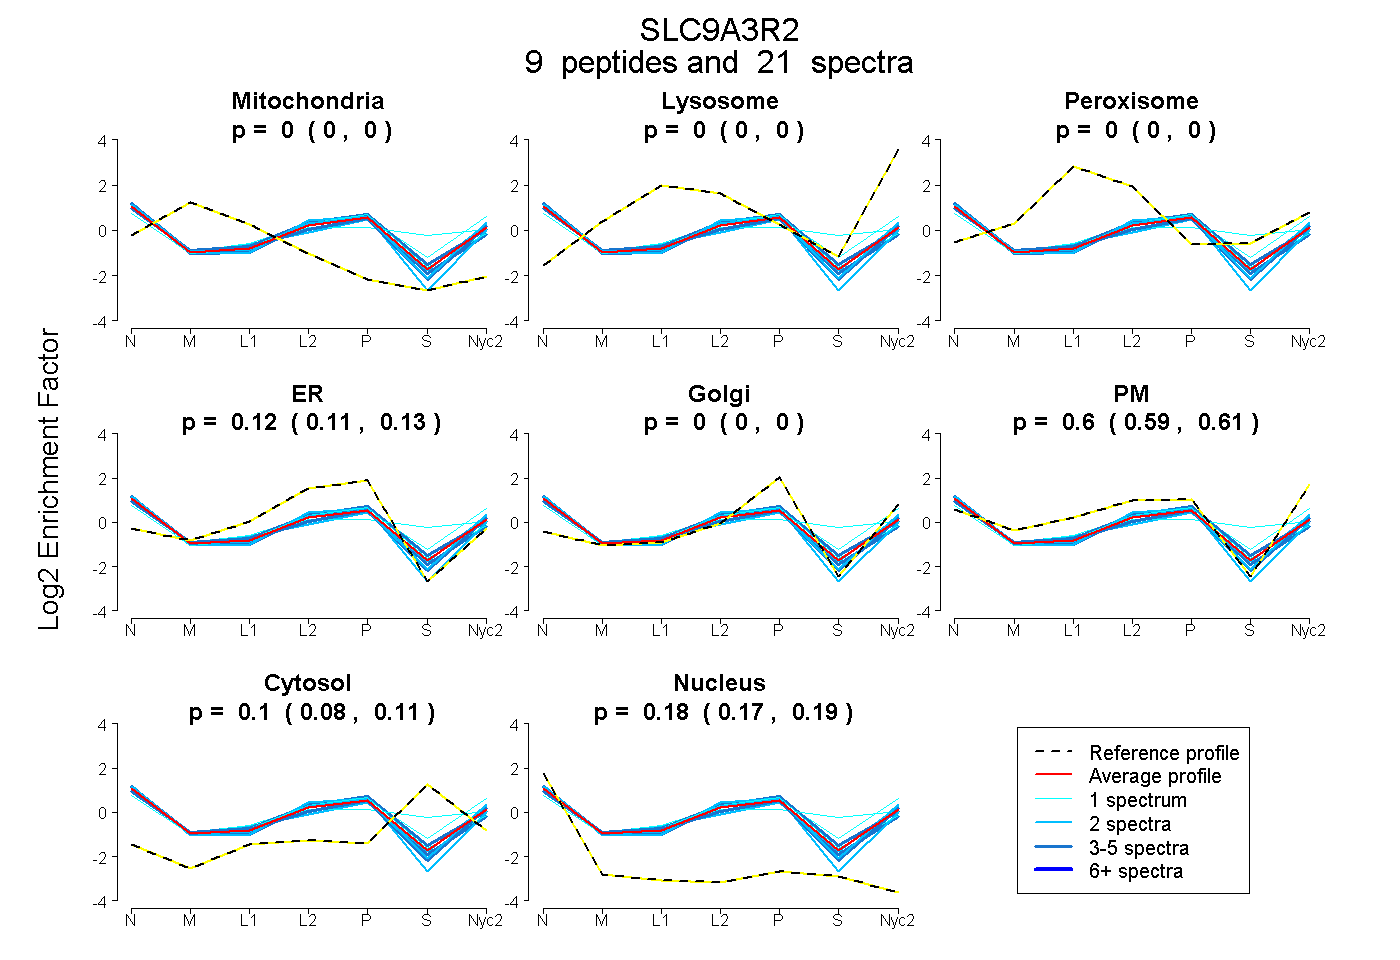
0.000 | 0.000
0.000 | 0.000
0.000 | 0.000
0.110 | 0.134
0.000 | 0.000
0.587 | 0.610
0.080 | 0.108
0.173 | 0.188
| Plot | Mito | Lyso | Perox | ER | Golgi | PM | Cytosol | Nucleus | |||||
| Expt A |
9 peptides |
21 spectra |
|
0.000 0.000 | 0.000 |
0.000 0.000 | 0.000 |
0.000 0.000 | 0.000 |
0.123 0.110 | 0.134 |
0.000 0.000 | 0.000 |
0.600 0.587 | 0.610 |
0.095 0.080 | 0.108 |
0.181 0.173 | 0.188 |
| 4 spectra, HAEVVAR | 0.000 | 0.000 | 0.000 | 0.190 | 0.000 | 0.536 | 0.135 | 0.139 | ||
| 2 spectra, GEQGYGFHLHGEK | 0.000 | 0.000 | 0.000 | 0.005 | 0.000 | 0.708 | 0.092 | 0.195 | ||
| 4 spectra, DVNGPPR | 0.000 | 0.000 | 0.000 | 0.228 | 0.000 | 0.497 | 0.053 | 0.223 | ||
| 2 spectra, VEPGSPAEAAALR | 0.000 | 0.000 | 0.000 | 0.064 | 0.015 | 0.691 | 0.025 | 0.204 | ||
| 1 spectrum, LLVVDPETDEHFK | 0.000 | 0.000 | 0.000 | 0.232 | 0.000 | 0.493 | 0.103 | 0.172 | ||
| 4 spectra, SVDPGSPASLSGLR | 0.000 | 0.000 | 0.000 | 0.061 | 0.036 | 0.657 | 0.010 | 0.236 | ||
| 1 spectrum, GPQGYGFNLHSDK | 0.000 | 0.000 | 0.000 | 0.000 | 0.000 | 0.713 | 0.201 | 0.086 | ||
| 2 spectra, LIEVNGQNVEGLR | 0.000 | 0.000 | 0.000 | 0.231 | 0.000 | 0.535 | 0.000 | 0.233 | ||
| 1 spectrum, LVEVNGVNVEGETHHQVVQR | 0.000 | 0.000 | 0.027 | 0.000 | 0.000 | 0.520 | 0.387 | 0.067 |
| Plot | Mito | Lyso or Perox | ER | Golgi | PM | Cytosol | Nucleus | ||||||
| Expt B |
5 peptides |
7 spectra |
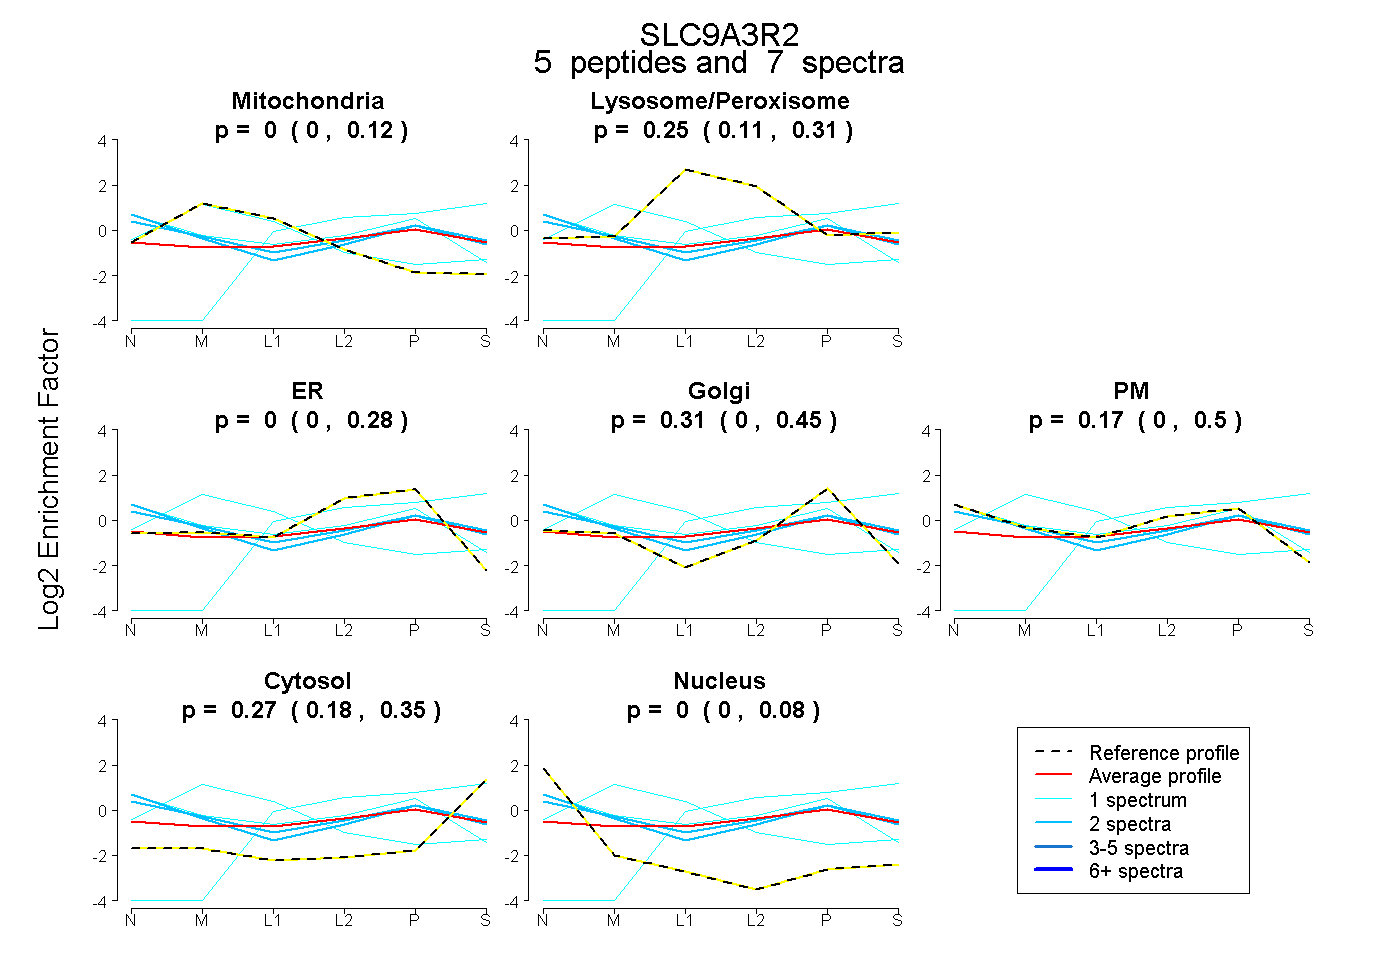 |
0.000 0.000 | 0.118 |
0.248 0.111 | 0.314 |
0.000 0.000 | 0.282 |
0.311 0.000 | 0.446 |
0.174 0.000 | 0.504 |
0.267 0.176 | 0.348 |
0.000 0.000 | 0.076 |
|||
| Plot | Lyso | Other | |||||||||||
| Expt C |
10 peptides |
35 spectra |
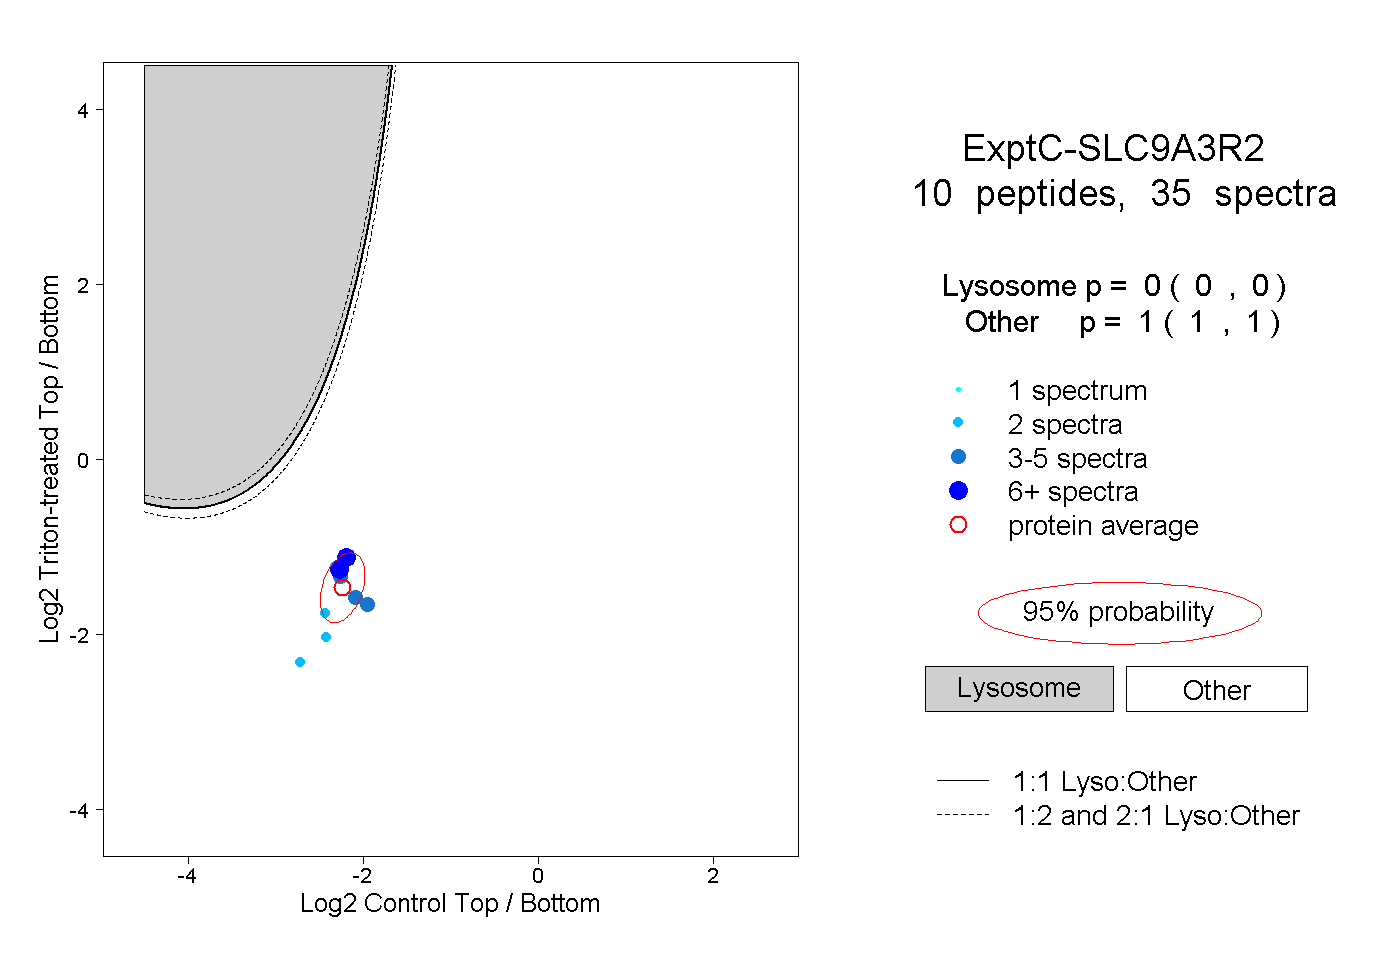 |
0.000 0.000 | 0.000 |
1.000 1.000 | 1.000 |
||||||||
| Plot | Lyso | Other | |||||||||||
| Expt D |
1 peptide |
1 spectrum |
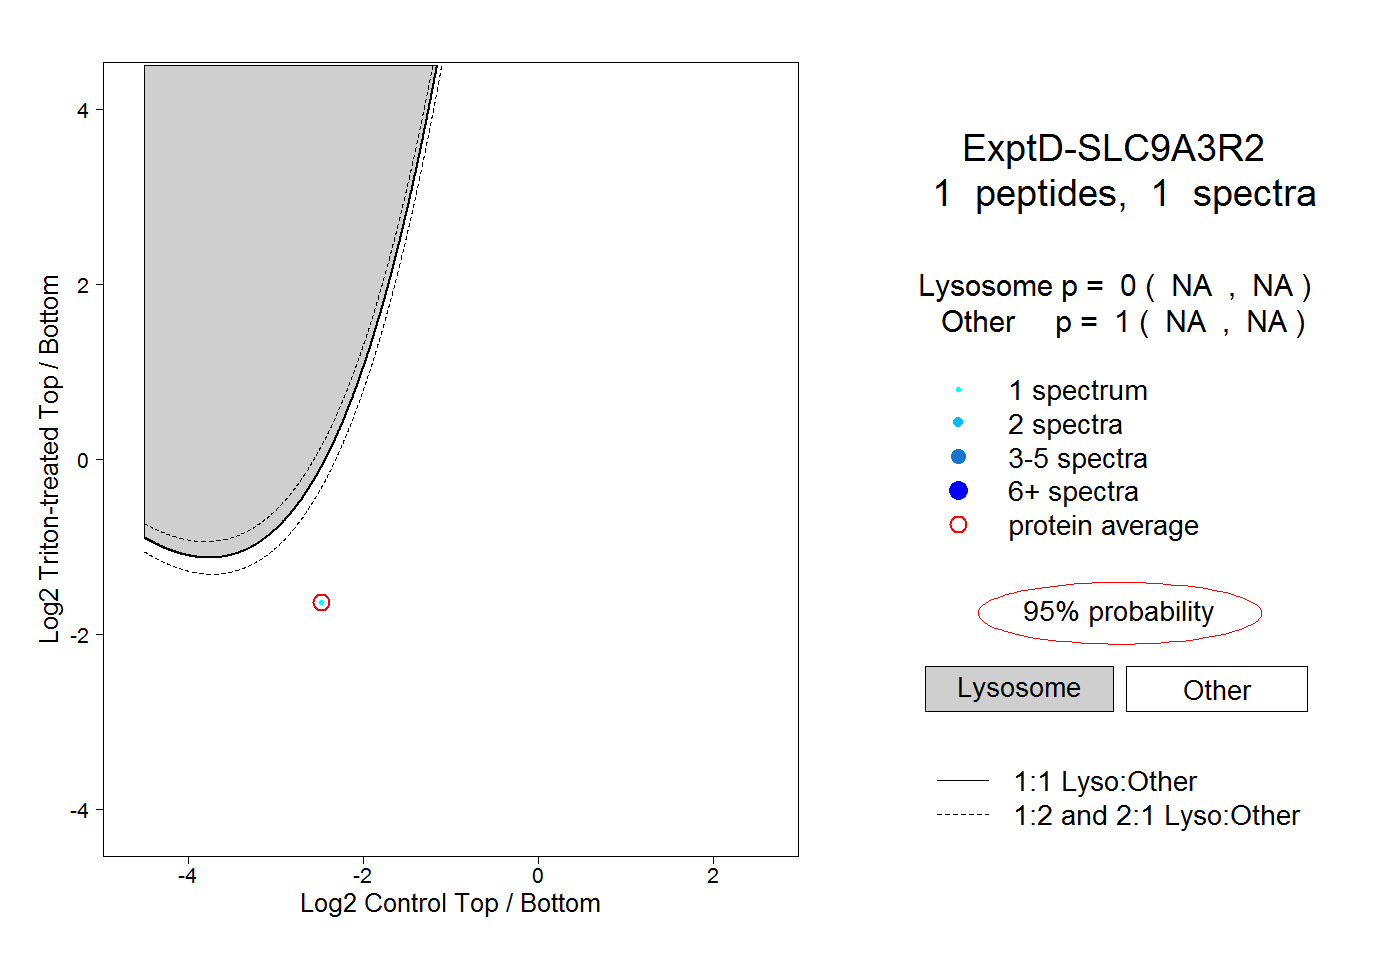 |
0.000 NA | NA |
1.000 NA | NA |