 8
8peptides
spectra
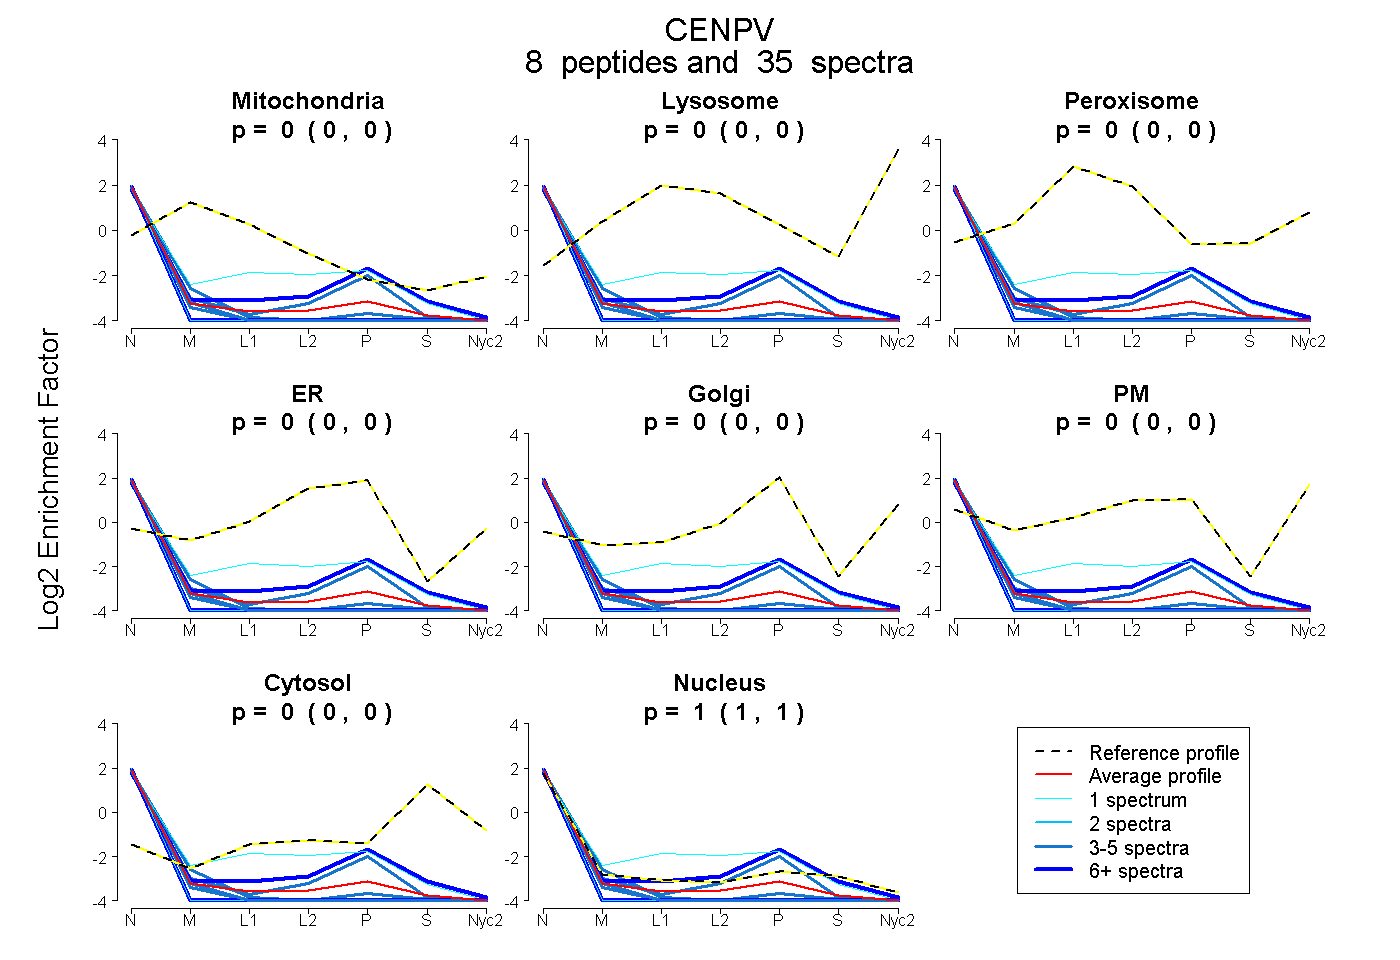
0.000 | 0.000
0.000 | 0.000
0.000 | 0.000
0.000 | 0.000
0.000 | 0.000
0.000 | 0.000
0.000 | 0.000
1.000 | 1.000
4peptides
spectra
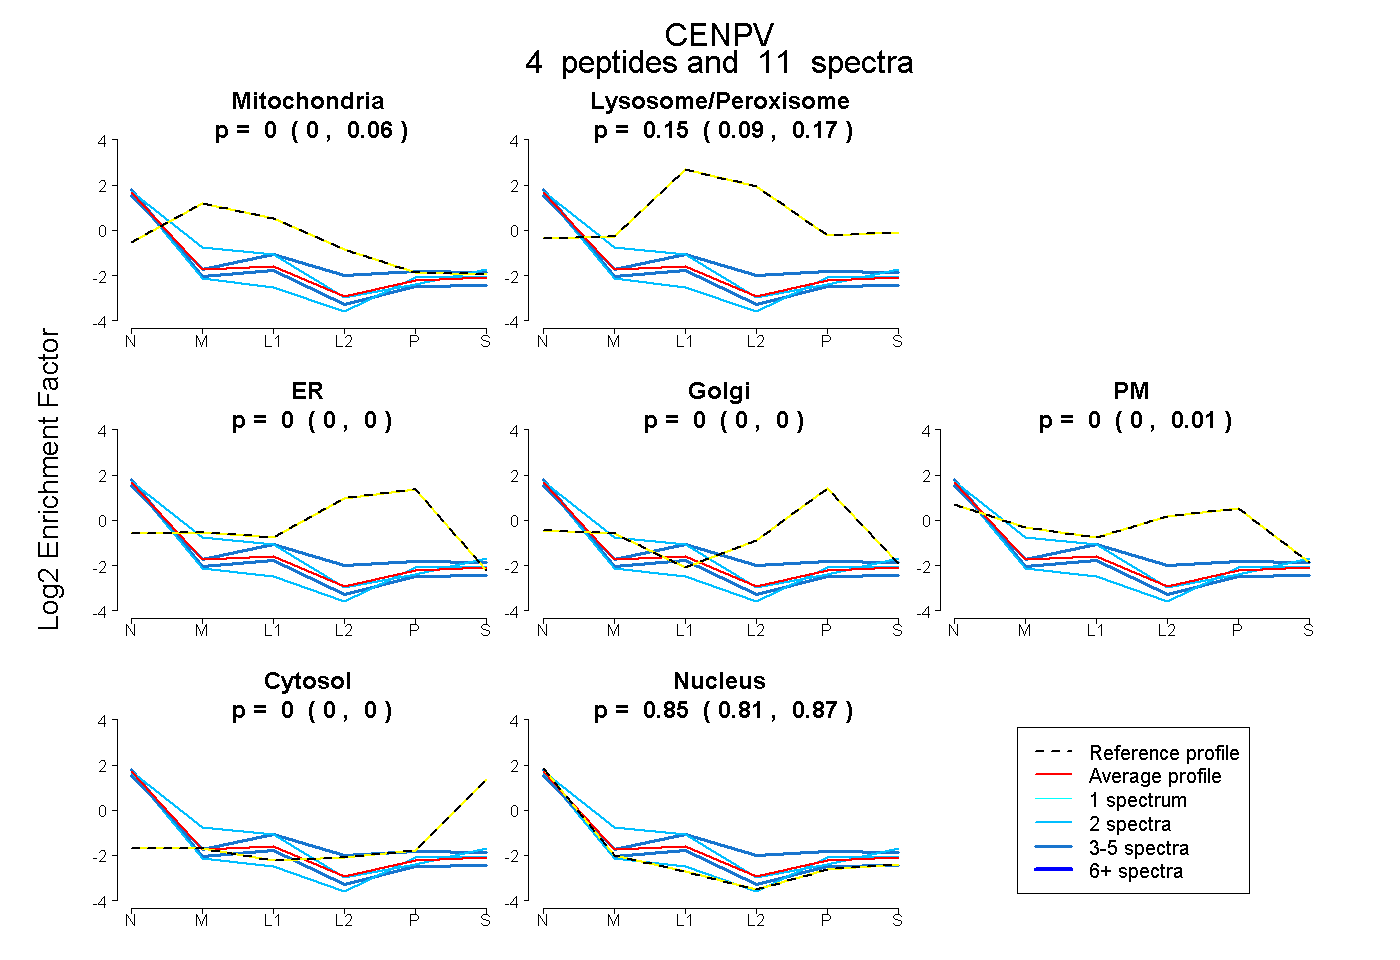
0.000 | 0.063
0.091 | 0.168
0.000 | 0.000
0.000 | 0.000
0.000 | 0.005
0.000 | 0.000
0.809 | 0.870