 2
2peptides
spectra
0.000 | 0.005
0.560 | 0.652
0.000 | 0.024
0.000 | 0.000
0.000 | 0.000
0.232 | 0.355
0.043 | 0.117
0.000 | 0.005
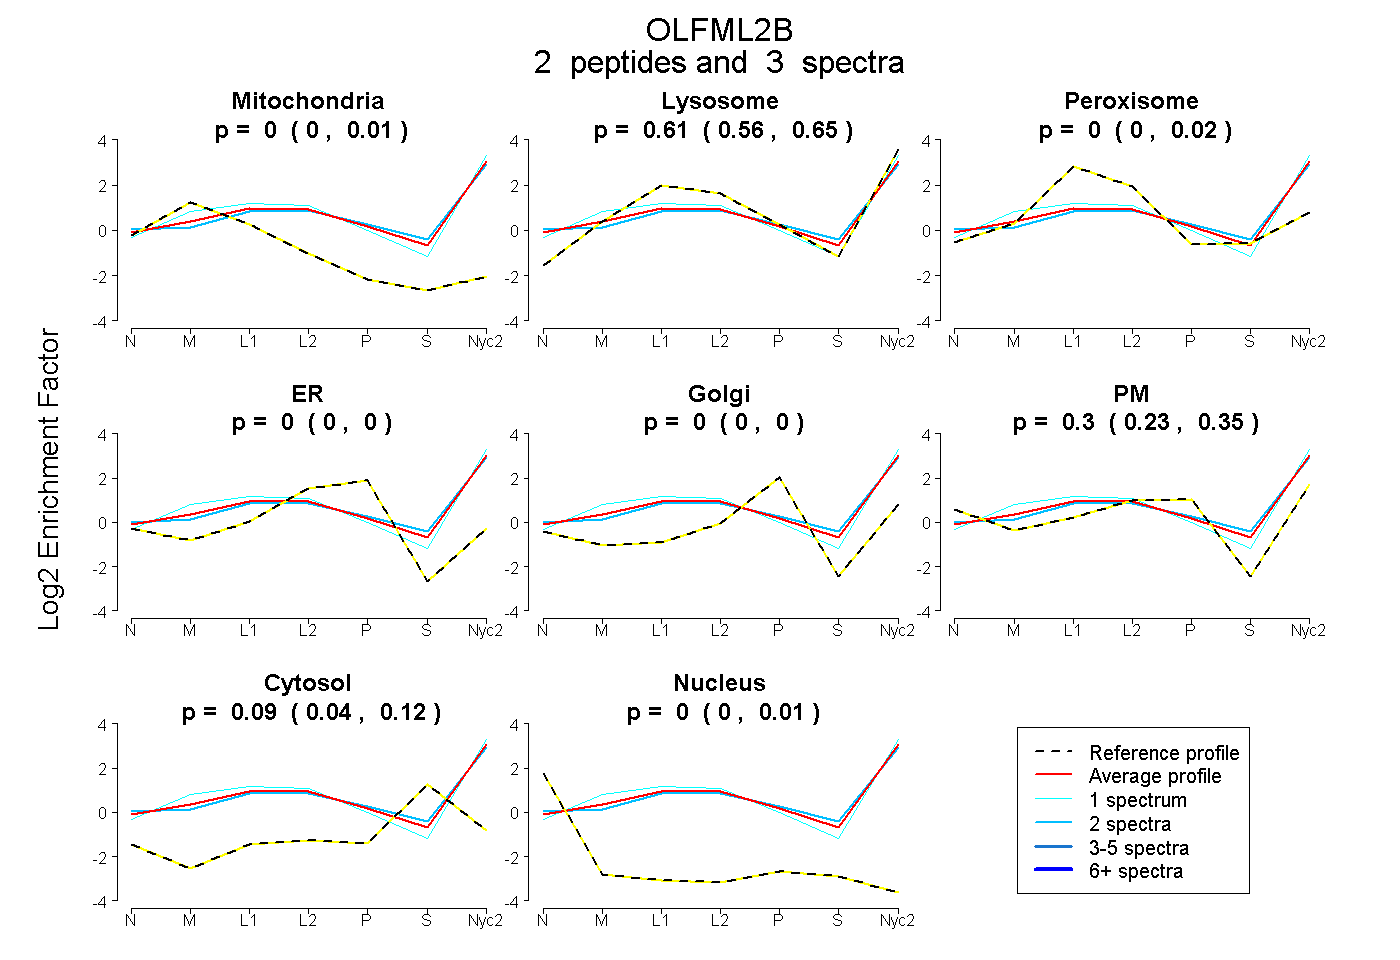
| Plot | Mito | Lyso | Perox | ER | Golgi | PM | Cytosol | Nucleus | |||||
| Expt A |
2 peptides |
3 spectra |
|
0.000 0.000 | 0.005 |
0.610 0.560 | 0.652 |
0.000 0.000 | 0.024 |
0.000 0.000 | 0.000 |
0.000 0.000 | 0.000 |
0.301 0.232 | 0.355 |
0.089 0.043 | 0.117 |
0.000 0.000 | 0.005 |
| 2 spectra, DAAAAYAHPEYEER | 0.000 | 0.566 | 0.000 | 0.000 | 0.000 | 0.306 | 0.129 | 0.000 | ||
| 1 spectrum, TQPLAPPTVMKPR | 0.055 | 0.709 | 0.000 | 0.000 | 0.000 | 0.236 | 0.000 | 0.000 |