 16
16peptides
spectra
0.000 | 0.000
0.001 | 0.003
0.000 | 0.000
0.997 | 0.999
0.000 | 0.000
0.000 | 0.000
0.000 | 0.000
0.000 | 0.000
| Plot | Mito | Lyso | Perox | ER | Golgi | PM | Cytosol | Nucleus | |||||
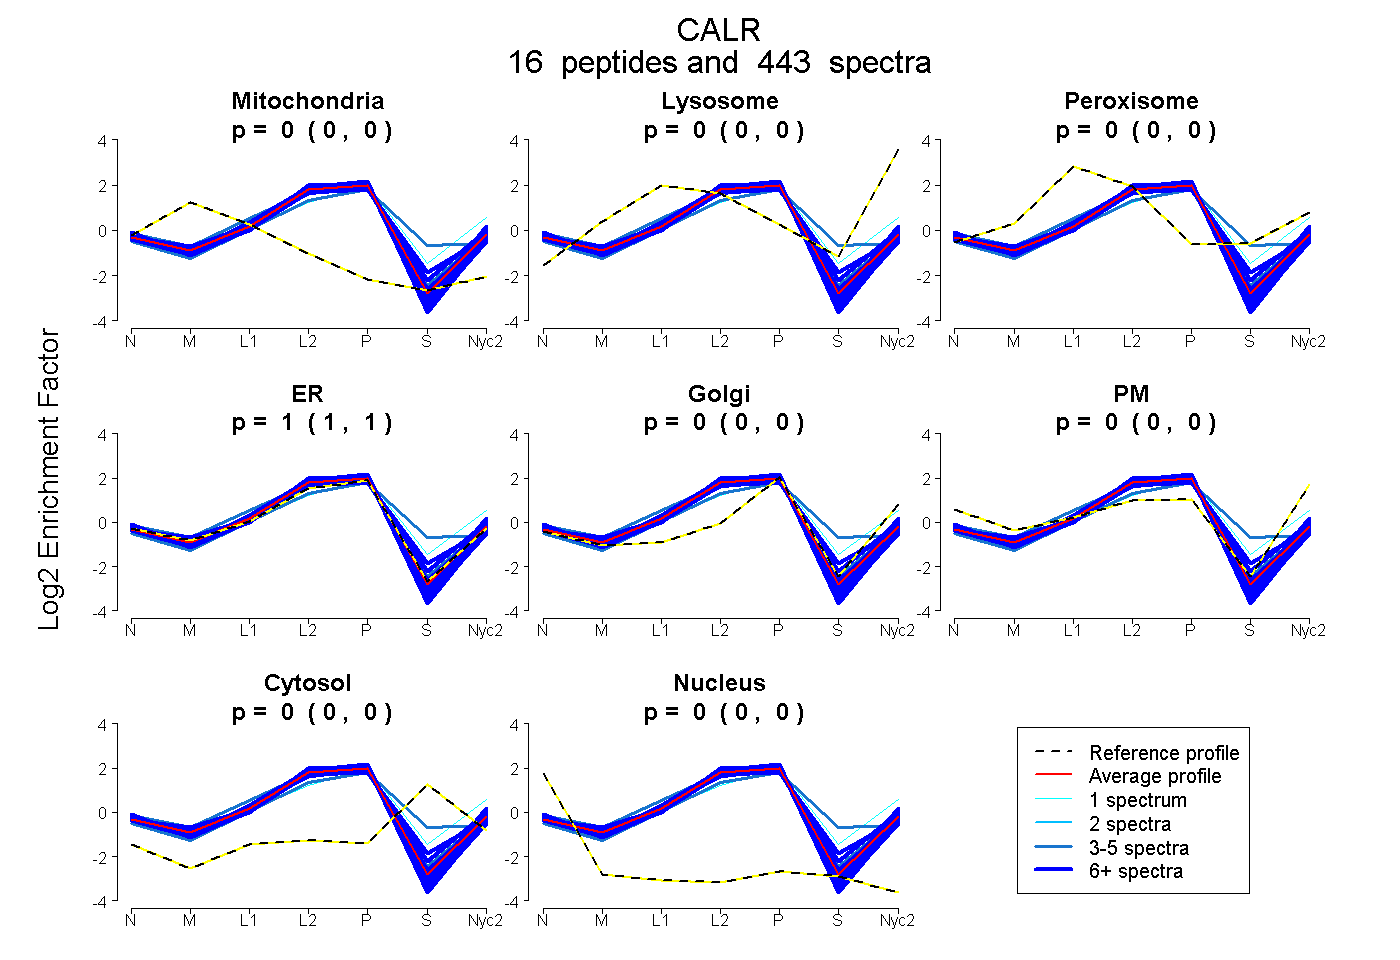
| Expt A |
16 peptides |
443 spectra |
|
0.000 0.000 | 0.000 |
0.002 0.001 | 0.003 |
0.000 0.000 | 0.000 |
0.998 0.997 | 0.999 |
0.000 0.000 | 0.000 |
0.000 0.000 | 0.000 |
0.000 0.000 | 0.000 |
0.000 0.000 | 0.000 |
| 14 spectra, NVLINK | 0.000 | 0.000 | 0.000 | 1.000 | 0.000 | 0.000 | 0.000 | 0.000 | ||
| 27 spectra, VHVIFNYK | 0.000 | 0.052 | 0.018 | 0.913 | 0.000 | 0.000 | 0.016 | 0.000 | ||
| 8 spectra, GQTLVVQFTVK | 0.000 | 0.003 | 0.000 | 0.962 | 0.000 | 0.034 | 0.000 | 0.000 | ||
| 21 spectra, FYGDQEK | 0.000 | 0.000 | 0.000 | 1.000 | 0.000 | 0.000 | 0.000 | 0.000 | ||
| 56 spectra, FYALSAR | 0.000 | 0.044 | 0.000 | 0.927 | 0.000 | 0.029 | 0.000 | 0.000 | ||
| 22 spectra, GEWKPR | 0.000 | 0.000 | 0.000 | 1.000 | 0.000 | 0.000 | 0.000 | 0.000 | ||
| 30 spectra, QIDNPDYK | 0.000 | 0.006 | 0.007 | 0.987 | 0.000 | 0.000 | 0.000 | 0.000 | ||
| 1 spectrum, DDEFTHLYTLIVRPDNTYEVK | 0.000 | 0.142 | 0.000 | 0.584 | 0.191 | 0.000 | 0.083 | 0.000 | ||
| 71 spectra, GLQTSQDAR | 0.000 | 0.000 | 0.000 | 1.000 | 0.000 | 0.000 | 0.000 | 0.000 | ||
| 51 spectra, LFPGGLDQK | 0.000 | 0.008 | 0.002 | 0.989 | 0.000 | 0.000 | 0.000 | 0.000 | ||
| 29 spectra, HEQNIDCGGGYVK | 0.000 | 0.000 | 0.042 | 0.885 | 0.000 | 0.000 | 0.073 | 0.000 | ||
| 5 spectra, DMHGDSEYNIMFGPDICGPGTK | 0.000 | 0.000 | 0.103 | 0.897 | 0.000 | 0.000 | 0.000 | 0.000 | ||
| 45 spectra, EQFLDGDAWTNR | 0.000 | 0.000 | 0.011 | 0.989 | 0.000 | 0.000 | 0.000 | 0.000 | ||
| 3 spectra, DPDAAKPEDWDER | 0.000 | 0.000 | 0.066 | 0.708 | 0.000 | 0.000 | 0.226 | 0.000 | ||
| 25 spectra, FEPFSNK | 0.000 | 0.000 | 0.000 | 1.000 | 0.000 | 0.000 | 0.000 | 0.000 | ||
| 35 spectra, FVLSSGK | 0.000 | 0.000 | 0.000 | 1.000 | 0.000 | 0.000 | 0.000 | 0.000 |
| Plot | Mito | Lyso or Perox | ER | Golgi | PM | Cytosol | Nucleus | ||||||
| Expt B |
14 peptides |
189 spectra |
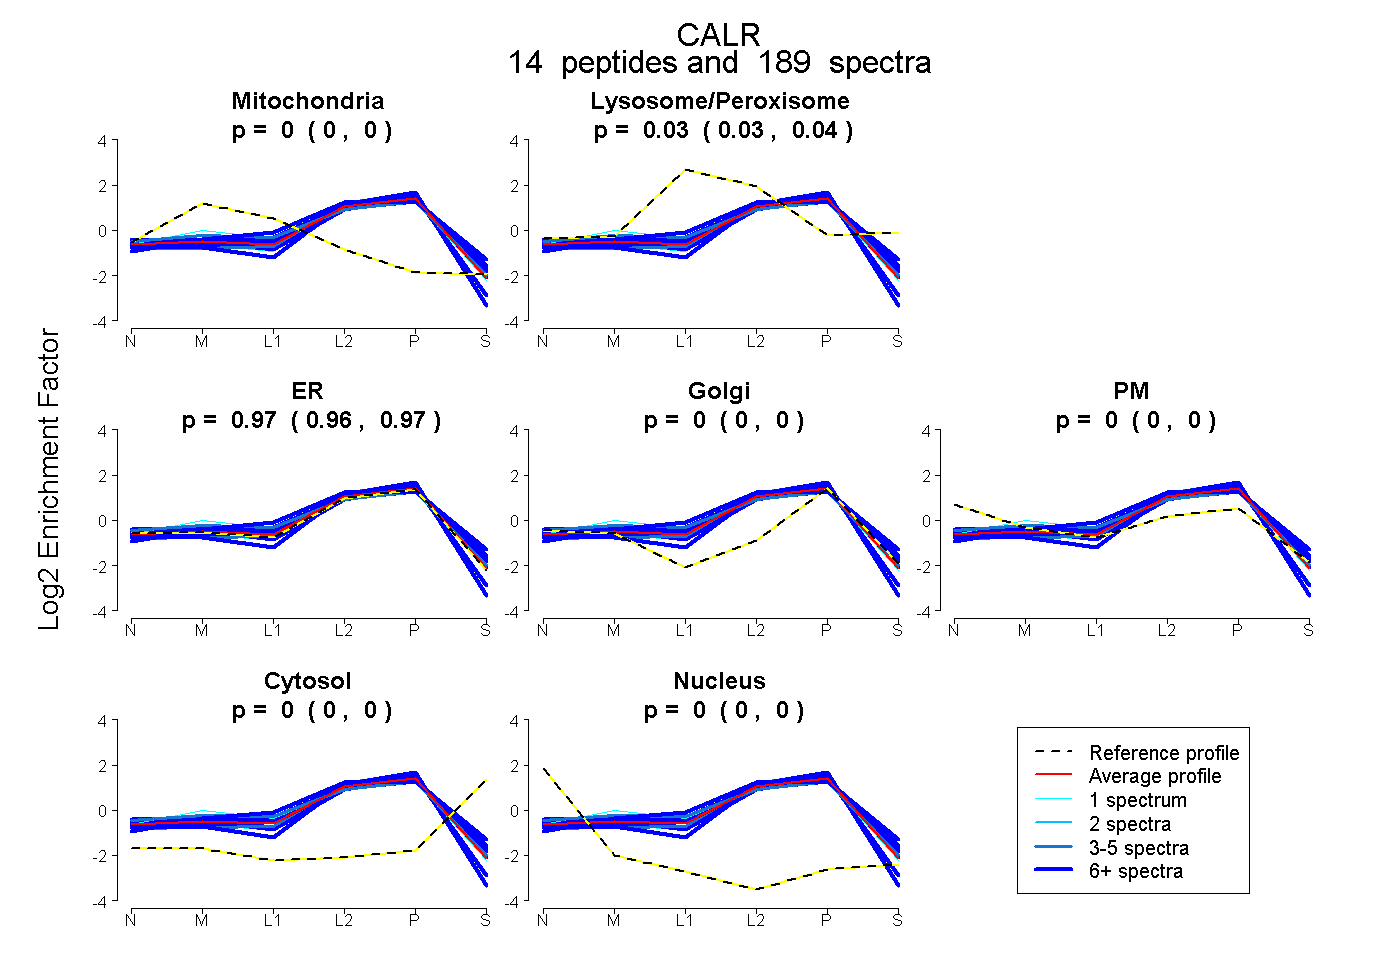 |
0.000 0.000 | 0.000 |
0.034 0.031 | 0.037 |
0.966 0.963 | 0.969 |
0.000 0.000 | 0.000 |
0.000 0.000 | 0.000 |
0.000 0.000 | 0.000 |
0.000 0.000 | 0.000 |
|||
| Plot | Lyso | Other | |||||||||||
| Expt C |
16 peptides |
826 spectra |
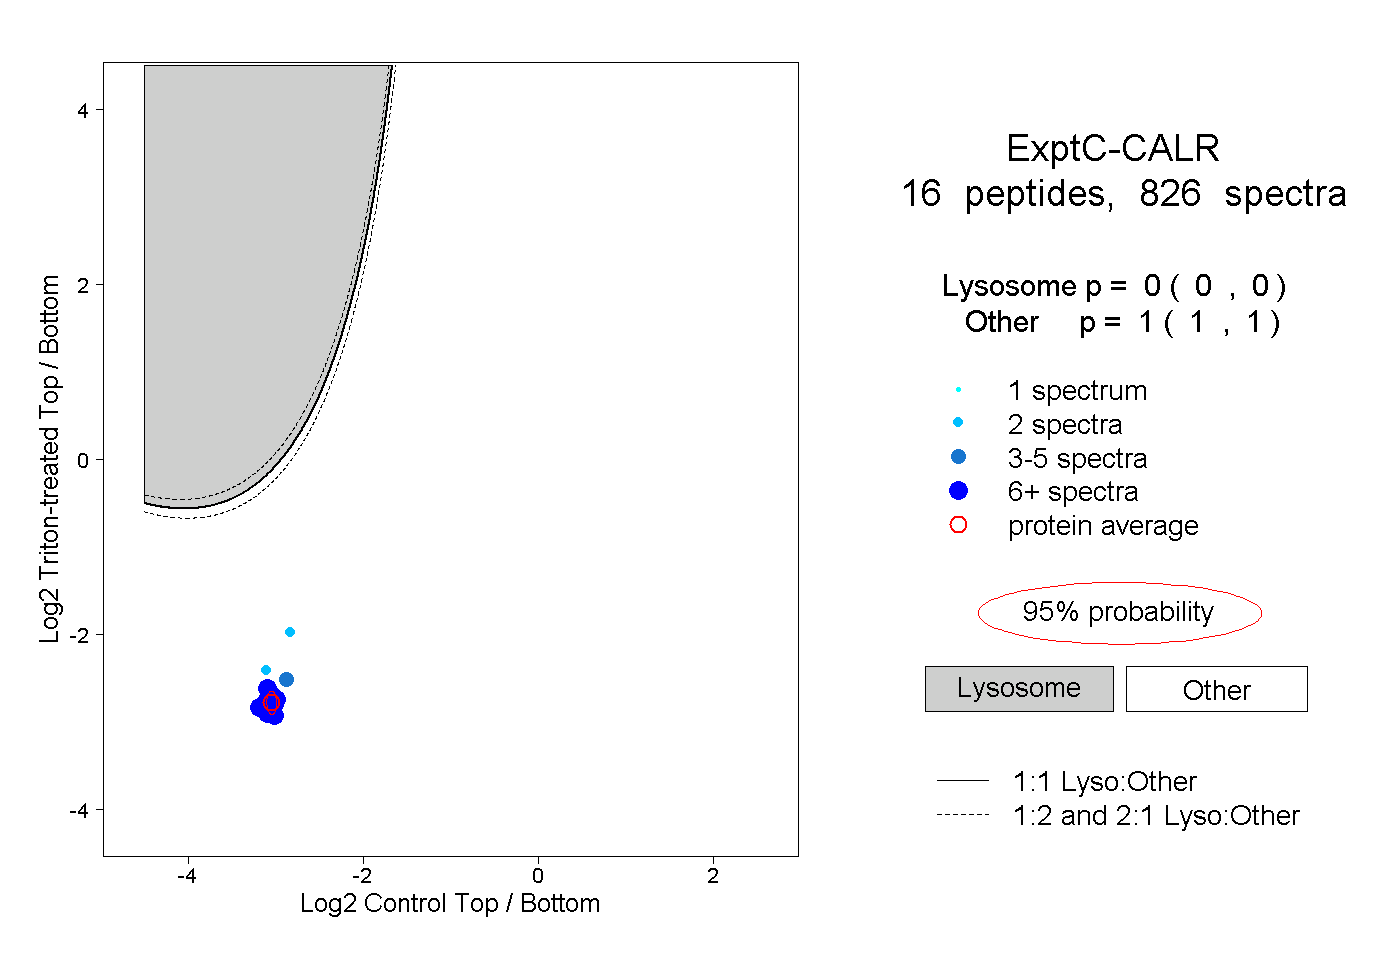 |
0.000 0.000 | 0.000 |
1.000 1.000 | 1.000 |
||||||||
| Plot | Lyso | Other | |||||||||||
| Expt D |
13 peptides |
67 spectra |
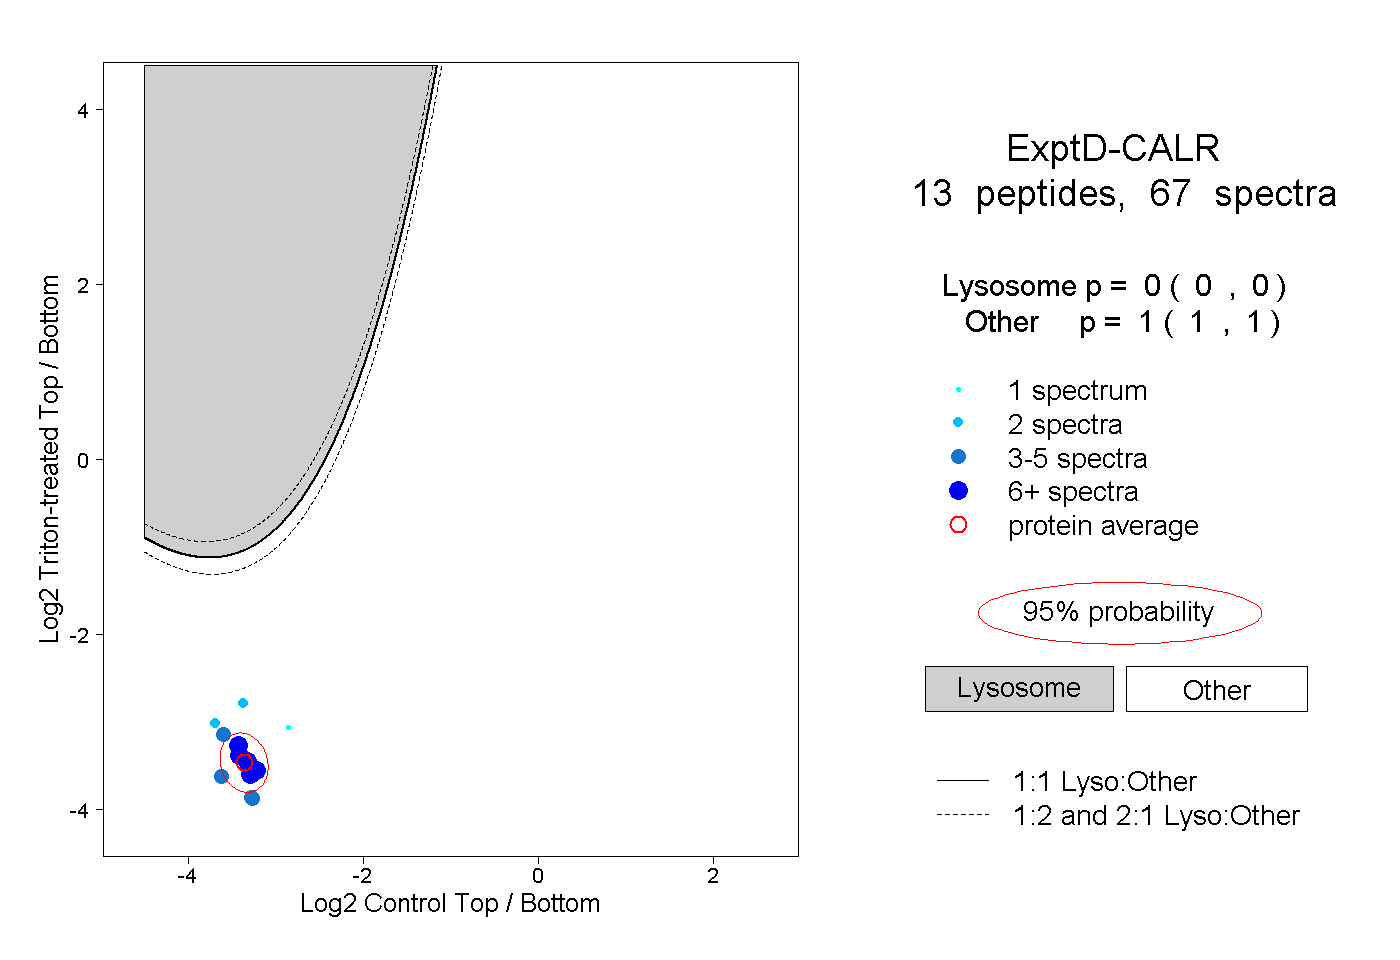 |
0.000 0.000 | 0.000 |
1.000 1.000 | 1.000 |