 3
3peptides
spectra
0.000 | 0.071
0.000 | 0.000
0.000 | 0.000
0.000 | 0.519
0.005 | 0.565
0.000 | 0.383
0.000 | 0.000
0.206 | 0.379
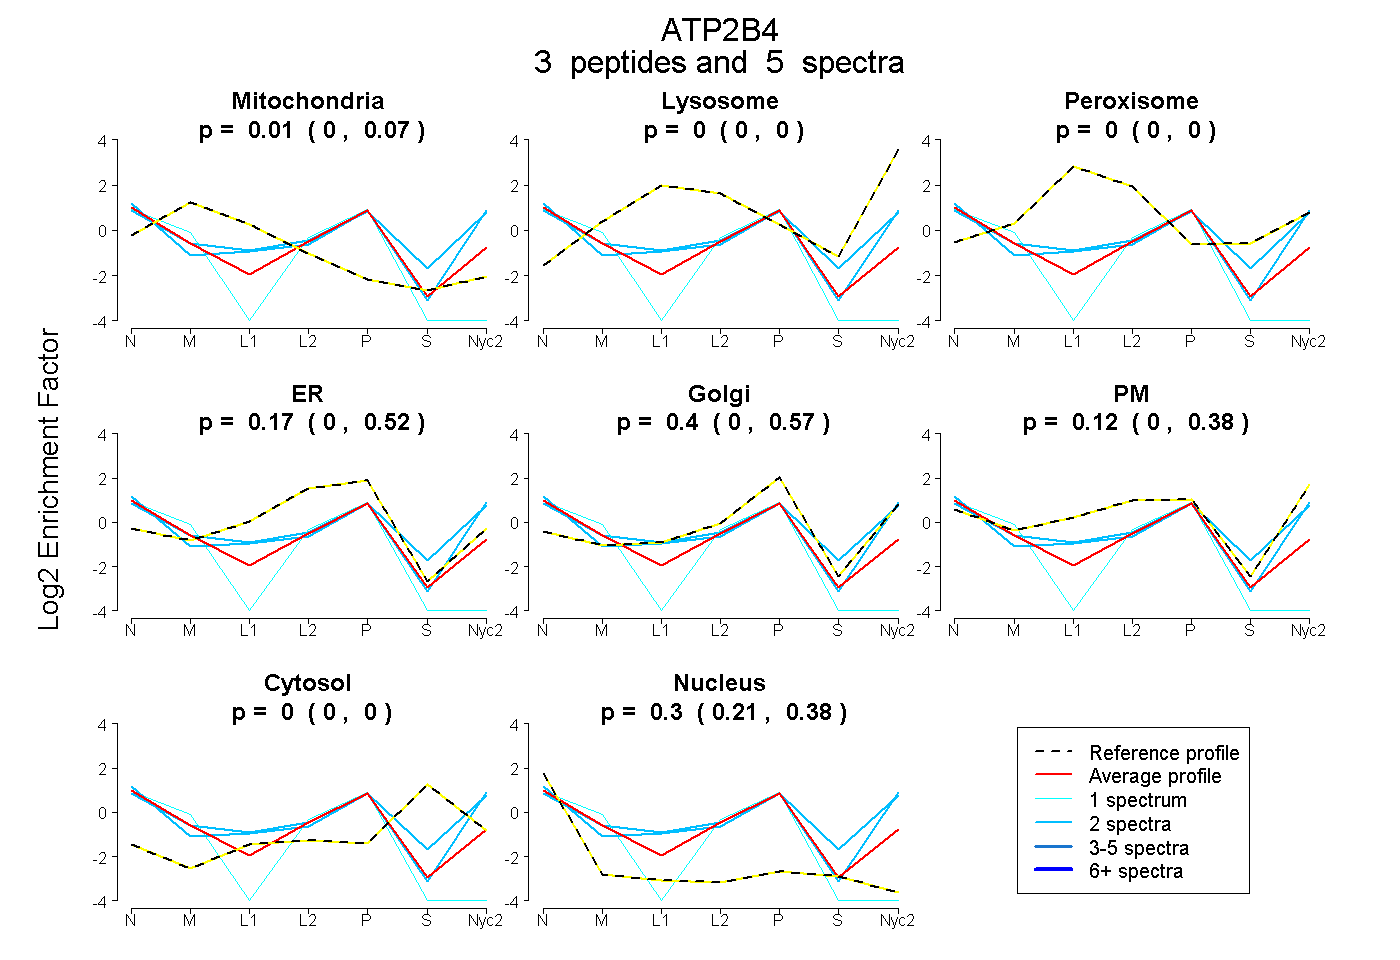
| Plot | Mito | Lyso | Perox | ER | Golgi | PM | Cytosol | Nucleus | |||||
| Expt A |
3 peptides |
5 spectra |
|
0.006 0.000 | 0.071 |
0.000 0.000 | 0.000 |
0.000 0.000 | 0.000 |
0.169 0.000 | 0.519 |
0.403 0.005 | 0.565 |
0.122 0.000 | 0.383 |
0.000 0.000 | 0.000 |
0.300 0.206 | 0.379 |
| 2 spectra, VFHSFR | 0.000 | 0.000 | 0.000 | 0.000 | 0.258 | 0.538 | 0.000 | 0.204 | ||
| 2 spectra, MVTGDNVNTAR | 0.000 | 0.000 | 0.000 | 0.000 | 0.234 | 0.547 | 0.087 | 0.132 | ||
| 1 spectrum, TECGLLGFVTDLK | 0.000 | 0.000 | 0.000 | 0.447 | 0.000 | 0.000 | 0.000 | 0.553 |