 5
5peptides
spectra
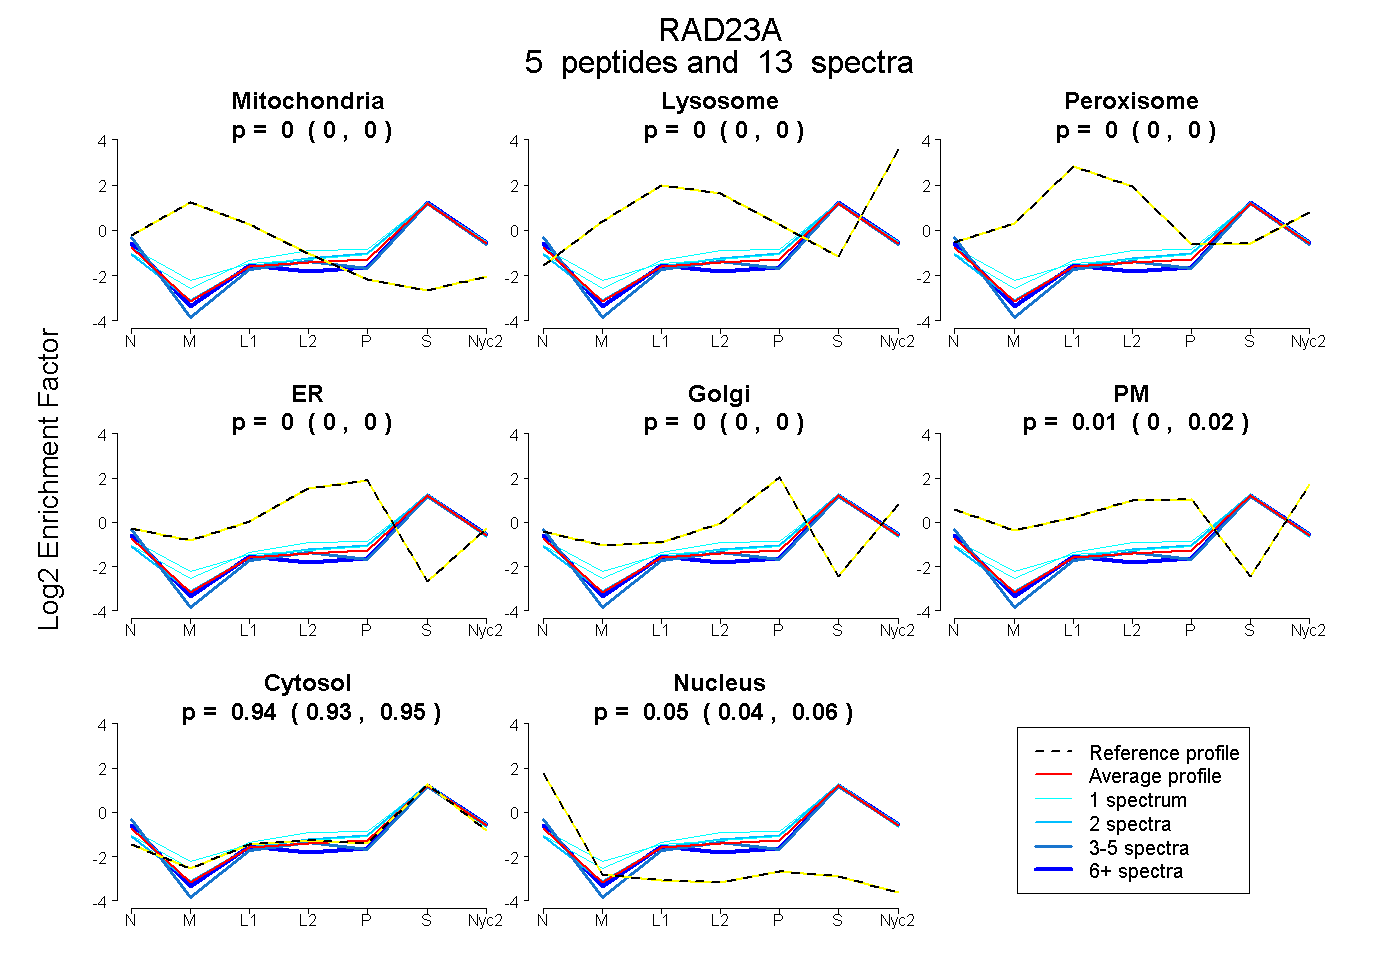
0.000 | 0.000
0.000 | 0.000
0.000 | 0.000
0.000 | 0.000
0.000 | 0.003
0.000 | 0.019
0.931 | 0.950
0.039 | 0.057
| Plot | Mito | Lyso | Perox | ER | Golgi | PM | Cytosol | Nucleus | |||||
| Expt A |
5 peptides |
13 spectra |
|
0.000 0.000 | 0.000 |
0.000 0.000 | 0.000 |
0.000 0.000 | 0.000 |
0.000 0.000 | 0.000 |
0.000 0.000 | 0.003 |
0.009 0.000 | 0.019 |
0.942 0.931 | 0.950 |
0.048 0.039 | 0.057 |
| 1 spectrum, NFVVVMVTK | 0.000 | 0.000 | 0.000 | 0.000 | 0.000 | 0.081 | 0.889 | 0.030 | ||
| 2 spectra, MEPDETVK | 0.000 | 0.000 | 0.000 | 0.000 | 0.033 | 0.000 | 0.964 | 0.003 | ||
| 3 spectra, VVAALR | 0.000 | 0.000 | 0.000 | 0.000 | 0.000 | 0.000 | 0.894 | 0.106 | ||
| 1 spectrum, EYHIDEK | 0.000 | 0.000 | 0.000 | 0.000 | 0.019 | 0.081 | 0.900 | 0.000 | ||
| 6 spectra, DQPQFQNMR | 0.000 | 0.000 | 0.000 | 0.000 | 0.000 | 0.000 | 0.913 | 0.087 |
| Plot | Lyso | Other | |||||||||||
| Expt C |
3 peptides |
4 spectra |
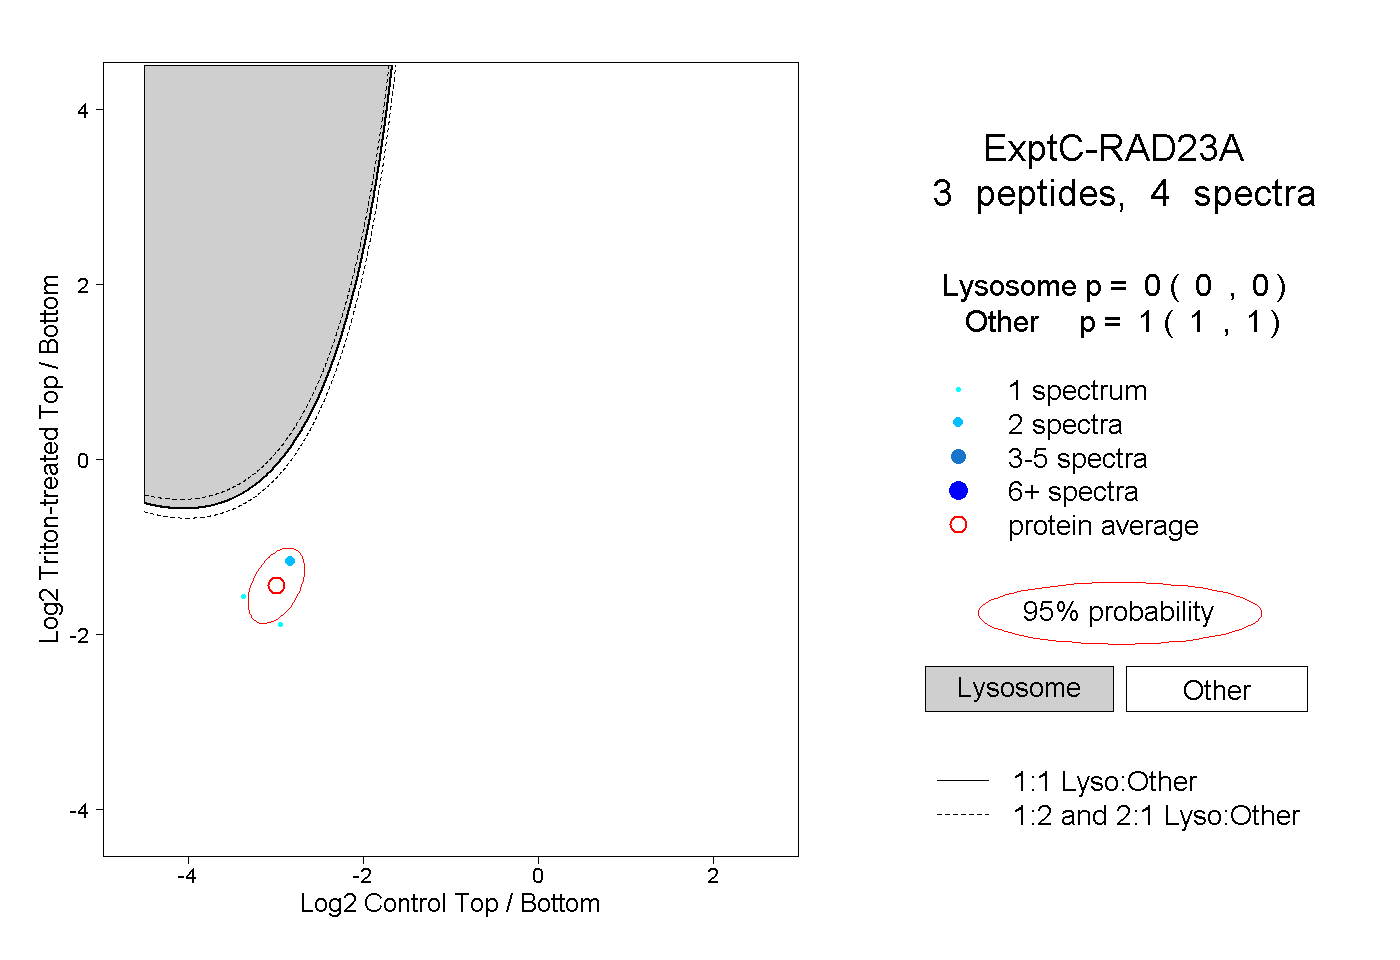 |
0.000 0.000 | 0.000 |
1.000 1.000 | 1.000 |