 5
5peptides
spectra
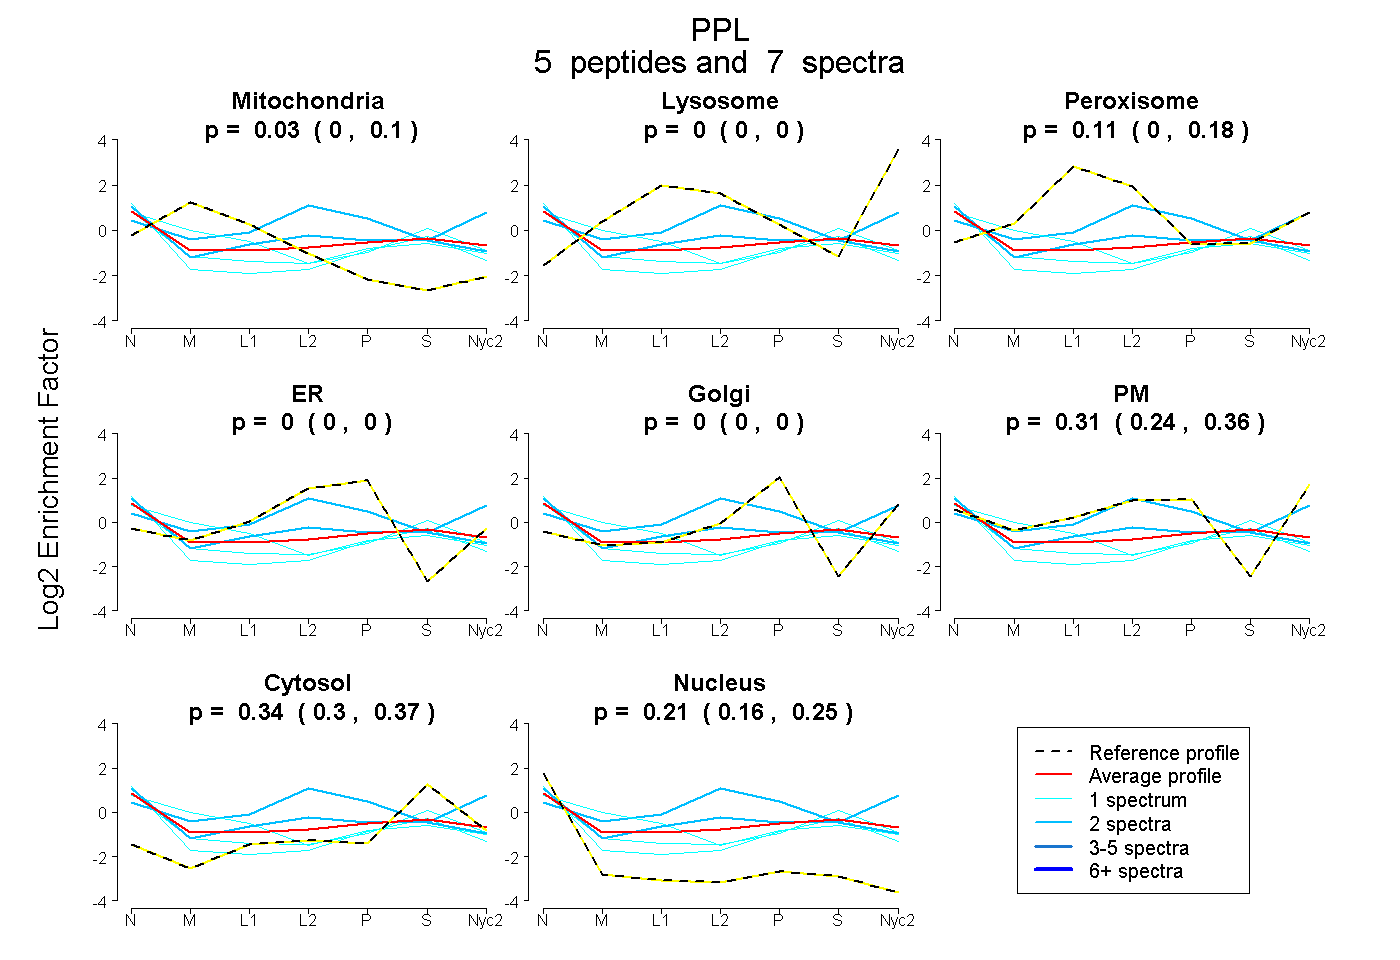
0.000 | 0.100
0.000 | 0.000
0.000 | 0.181
0.000 | 0.000
0.000 | 0.000
0.240 | 0.363
0.299 | 0.375
0.155 | 0.247
1peptide
spectrum
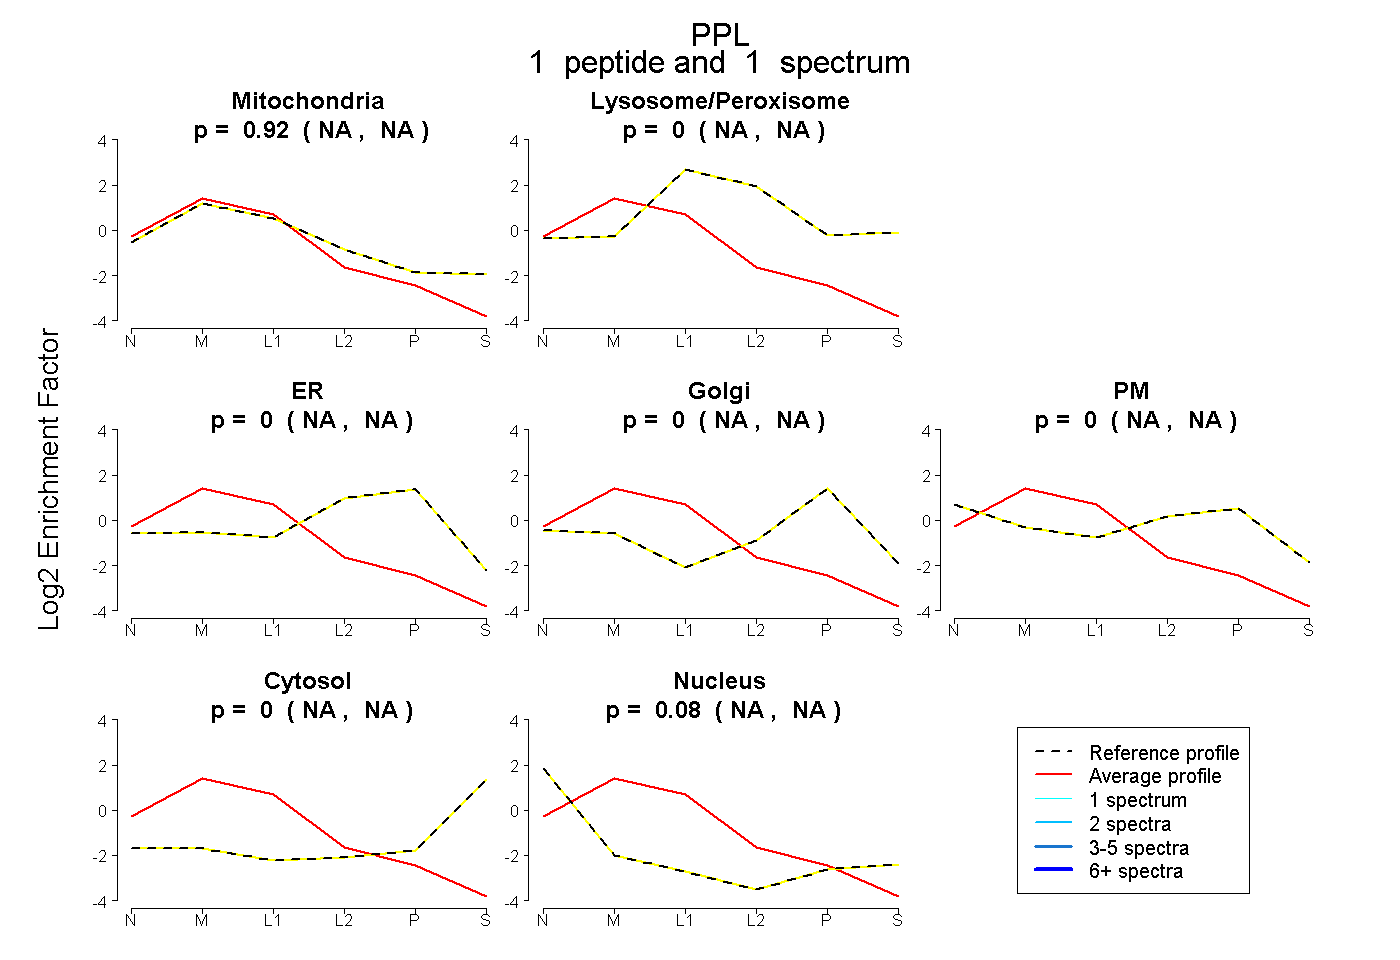
NA | NA
NA | NA
NA | NA
NA | NA
NA | NA
NA | NA
NA | NA
1peptide
spectrum
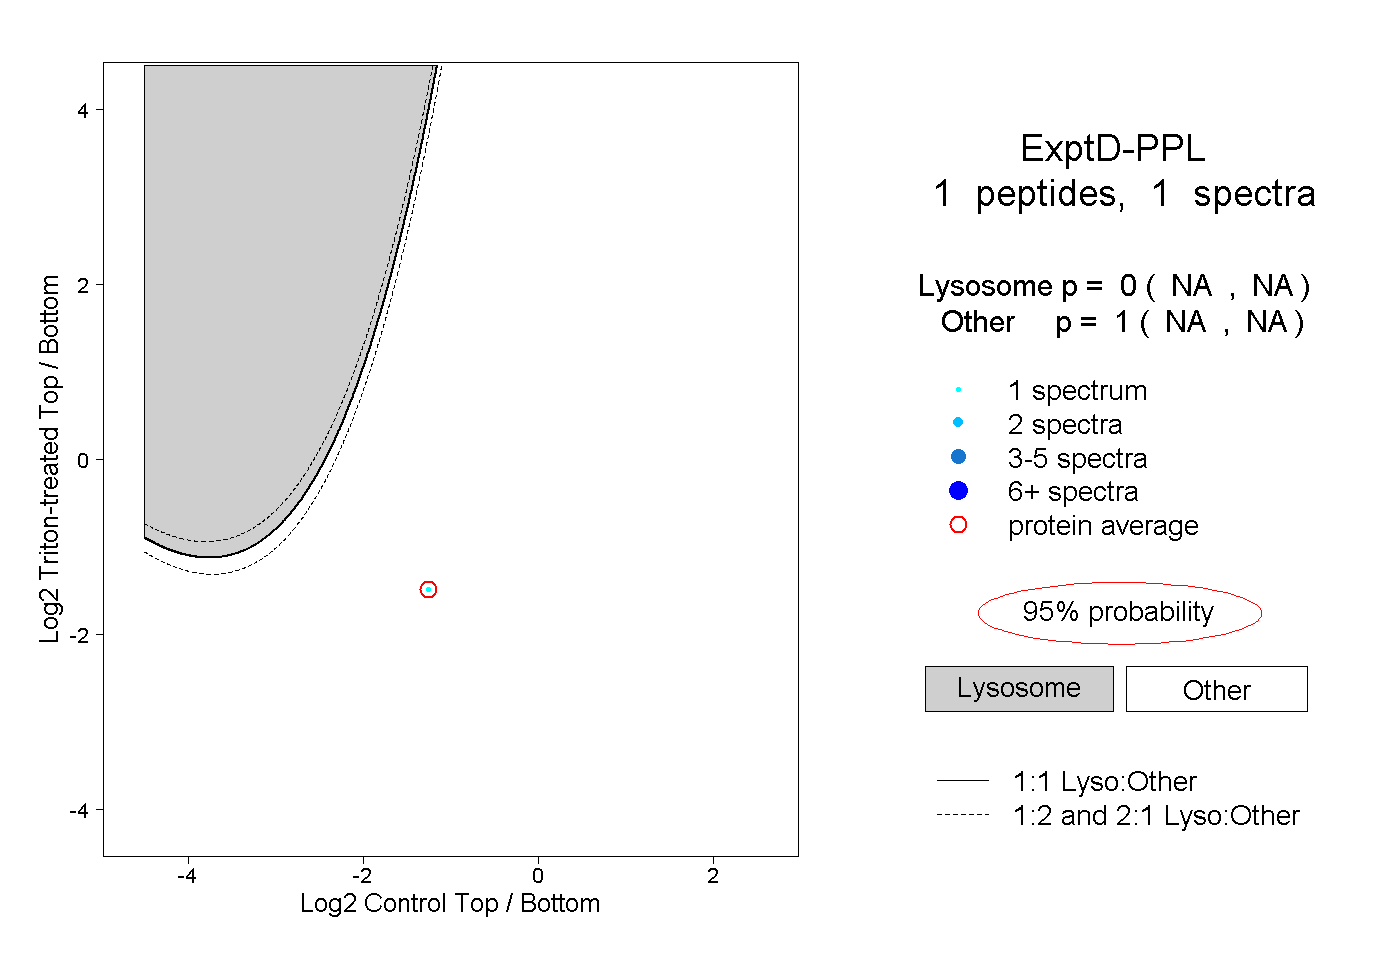
NA | NA
NA | NA