 6
6peptides
spectra
0.707 | 0.789
0.000 | 0.000
0.058 | 0.163
0.043 | 0.161
0.000 | 0.000
0.000 | 0.087
0.000 | 0.000
0.000 | 0.000
7peptides
spectra
0.000 | 0.000
1.000 | 1.000
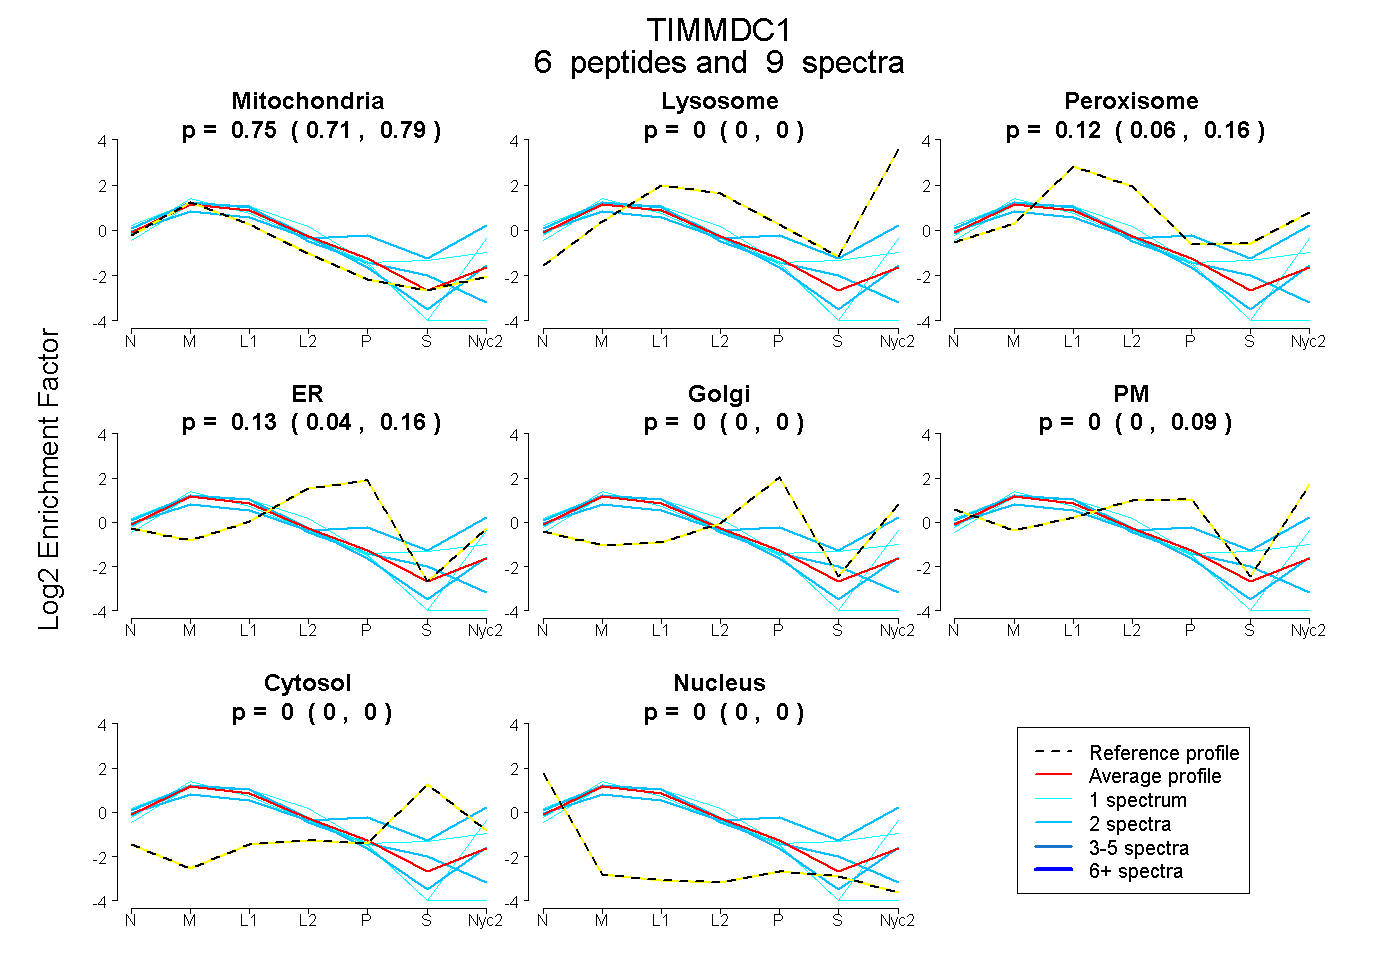
| Plot | Mito | Lyso | Perox | ER | Golgi | PM | Cytosol | Nucleus | |||||
| Expt A |
6 peptides |
9 spectra |
|
0.750 0.707 | 0.789 |
0.000 0.000 | 0.000 |
0.119 0.058 | 0.163 |
0.131 0.043 | 0.161 |
0.000 0.000 | 0.000 |
0.000 0.000 | 0.087 |
0.000 0.000 | 0.000 |
0.000 0.000 | 0.000 |
||
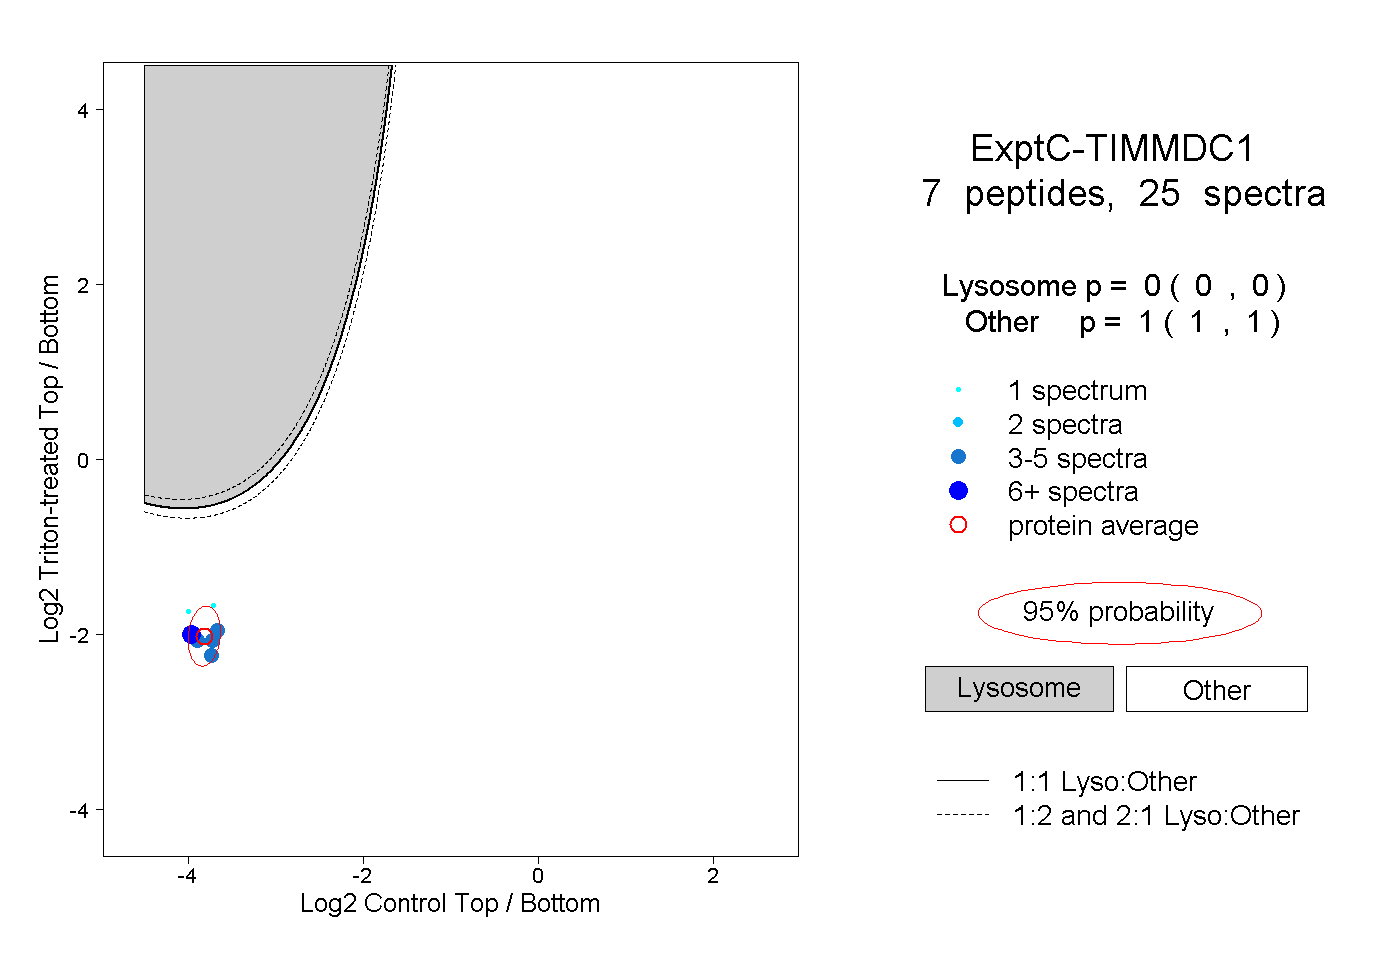
| Plot | Lyso | Other | |||||||||||
| Expt C |
7 peptides |
25 spectra |
|
0.000 0.000 | 0.000 |
1.000 1.000 | 1.000 |
| 4 spectra, YIEQSQAEIYHNR | 0.000 | 1.000 | ||||||||
| 6 spectra, SYVSDPGSSESGWDR | 0.000 | 1.000 | ||||||||
| 5 spectra, NPASPDK | 0.000 | 1.000 | ||||||||
| 3 spectra, FDAVQSAHR | 0.000 | 1.000 | ||||||||
| 5 spectra, EMDYICR | 0.000 | 1.000 | ||||||||
| 1 spectrum, INIGLR | 0.000 | 1.000 | ||||||||
| 1 spectrum, HCGETVQER | 0.000 | 1.000 |
| Plot | Lyso | Other | |||||||||||
| Expt D |
1 peptide |
1 spectrum |
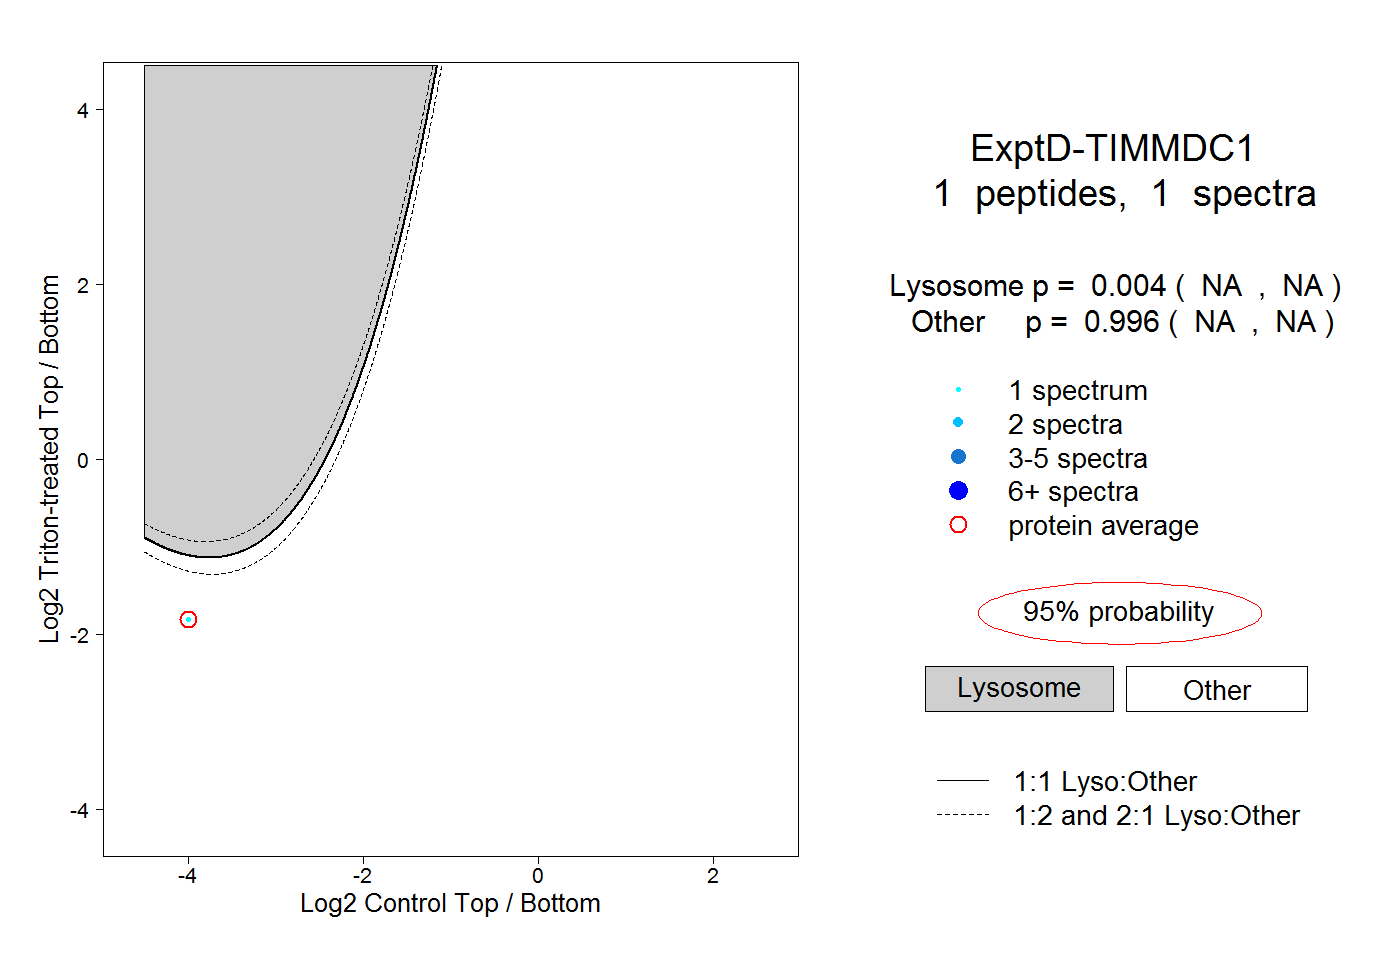 |
0.004 NA | NA |
0.996 NA | NA |